Check for issues during simulation
In the Browser, select the milling setup or the individual operations you want to simulate.
Tip: Hold theCtrlkey to multiselect operations.On the Manufacture workspace toolbar, click Actions > Simulate with Machine
 or Actions > Simulate
  .Note: If simulating without a machine, in Preferences > General > Manufacture > Optional Features, ensure that the Stock Simulation Improvements checkbox is selected.
A dialog is displayed, and the Simulation contextual environment opens, replacing all the tabs in the Manufacture workspace.
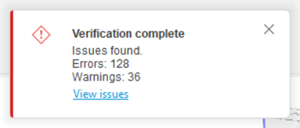
The verification process starts immediately. If there are any simulation issues, a notification appears. Issues are marked on the timeline in red (for errors) or orange (for warnings).

If there are any process issues, a notification appears for each issue.

On the Simulation contextual environment’s toolbar, click Information > Issues
 .
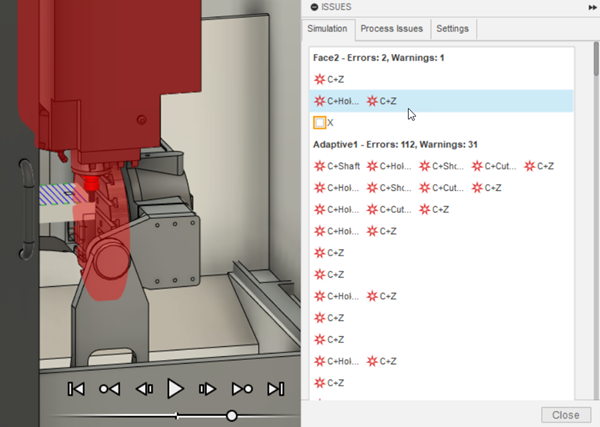
.In the Issues dialog, in the Simulation tab, review the chronological list of issues.
(Optional) To update the simulation on the canvas and review the position of the machine at the point where an issue occurred, click an issue in the list.
For example, here there is a collision between the machine’s C axis (table) and the tool holder and between the machine’s C axis and Z axis:
 Tip: Use the Machine Definition dialog’s Kinematics tab to choose which pairs of items of a machine are included or excluded from collision checks. Collision checking against many items can slow the verification process during machine simulation. If you exclude pairs of items from the checks, collisions with those pairs are not reported.
(Optional) To view a list of problems with how machine simulation is operating, click the dialog’s Process Issues tab.
(Optional) To stop playback when a simulation issue is encountered, and to choose to hide warnings on the timeline, click the dialog’s Settings tab and set your preferences for Errors and Warnings.
Use the player controls and timeline to navigate the simulation.
Use the other options on the toolbar and in the dialog to control the visibility of the tool, machine, toolpaths, and stock during the simulation, and to view the NC code.