Analysis tools
The tools in the Inspect panel let you measure and analyze the elements of your design in Fusion.
You can use the following tools to analyze your design:
- Measure

- Interference

- Curvature Comb Analysis

- Zebra Analysis

- Draft Analysis

- Fastener Stack Analysis
- Curvature Map Analysis

- Isocurve Analysis

- Accessibility Analysis

- Minimum Radius Analysis

- Section Analysis

- Center of Mass

- Display Component Colors

- Find Similar Components

Measure
The Measure tool reports distance, angle, area, or position data of the selected object.
The measurement that displays is the minimum distance between the two selections.
You can click a value in the Measure dialog to copy it to the clipboard.
Interference
The Interference tool reports any interferences between selected solid bodies or components.
You can create new components from the interferences.
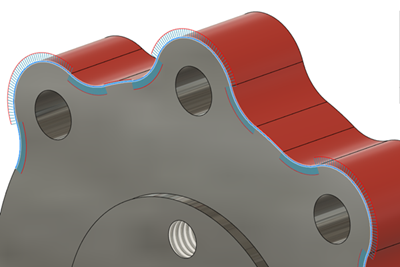
Curvature Comb Analysis
The Curvature Comb Analysis tool displays a comb with sample points along an edge of a body to help you analyze the curvature of a surface in Fusion.
The curvature comb displays a plot of the curvature of each edge you select.
You can use the Curvature Comb Analysis tool to analyze the curvature along a single edge or to analyze curvature continuity at the transitions between edges.
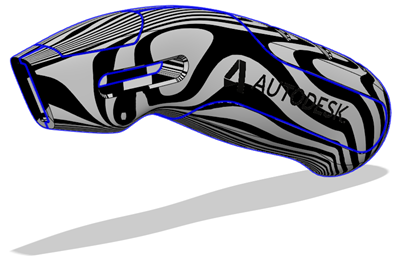
Zebra Analysis
The Zebra Analysis tool displays alternating black and white stripes on a body to help you analyze the curvature of a surface in Fusion.
Zebra Analysis projects parallel lines onto the selected body to visualize curvature continuity.
The result shows how light reflects off the surface. You can use these reflections to identify areas you need to adjust in order to improve the aesthetic quality of the surface. The smoother the transition in zebra stripes between surfaces, the better the continuity, and the smoother the surface will appear when it is manufactured.
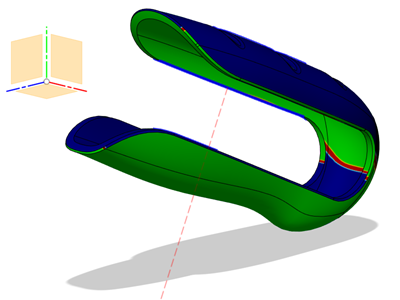
Draft Analysis
The Draft Analysis tool displays a color gradient on the faces of selected bodies to help evaluate the manufacturability of your design.
You select the bodies to evaluate and the axis to define the direction, then adjust options to refine the gradient display.
You can use draft analysis to evaluate positions for a parting line or to find areas of zero draft or undercuts.
Fastener Stack Analysis
The Fastener Stack Analysis tool checks fastener stacks in your design and shows which stacks have issues. You can run the analysis at any time. It is most useful when your design includes fasteners used in a bolted connection (for example bolts or screws, washers, and nuts). For meaningful results, include at least one fastener stack: a combination of holes and those fasteners inserted with Insert Fastener.
In the Assembly Design or Hybrid Design workflow, click Inspect > Fastener Stack Analysis. Results appear in the canvas and in the Browser > Analysis folder.
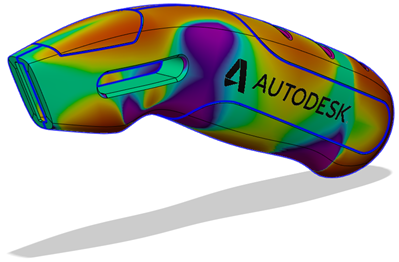
Curvature Map Analysis
The Curvature Map Analysis tool displays a color gradient on a body to help you analyze areas of high and low surface curvature in Fusion.
There are 3 types of curvature maps:
- Gaussian
- Red, Orange, Yellow: Region has positive curvature.
- Green: Region is a flat surface in one or both directions.
- Blue, Indigo, Violet: Region has negative curvature.
- Principal Minimum
- Green: Region meets Maximum Limit threshold.
- Red: Region exceeds Maximum Limit threshold.
- Principal Maximum
- Green: Region meets Minimum Limit threshold.
- Red: Region exceeds Minimum Limit threshold.
Isocurve Analysis
The Isocurve Analysis tool applies UV mapping and curvature combs to help you analyze the quality of the curvature of a surface in Fusion.
You select the bodies or faces to analyze, select the isocurve type, then adjust the number of isocurves to display. You can also display curvature combs along the isocurves and control their density and scale.
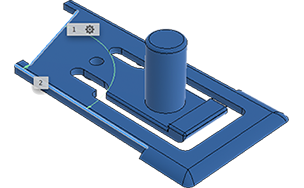
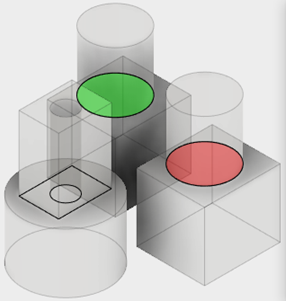
Accessibility Analysis
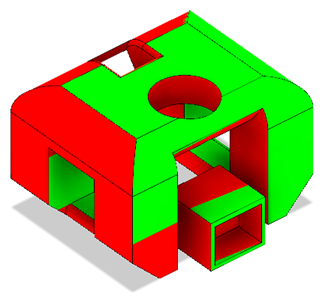
The Accessibility Analysis tool colors a body based on whether or not certain areas are accessible from a particular plane.
Regions that are accessible are highlighted green. Regions that are not accessible are highlighted red.
You can use Accessibility Analysis to check undercut areas through a plane.
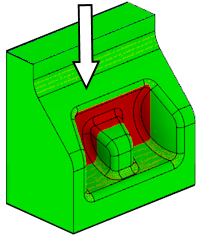
Accessibility Analysis highlights which parts of a body are visible from a particular direction. For example, you can use it during the manufacturing process to determine whether a part can be manufactured using 3-axis machining.
In the example below, the areas that are accessible from the direction of the Z-axis (or from the XY plane) are shaded in green. The areas that are not accessible are shaded in red.
Minimum Radius Analysis
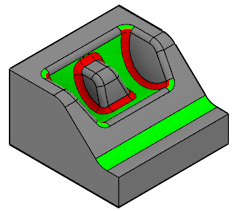
The Minimum Radius Analysis tool colors an object to represent the minimum radius for the curvature of the concave faces.
Regions with a higher curvature than the minimum radius are highlighted red.
You can use Minimum Radius Analysis to detect the minimum fit for holes and fillets, in order to determine tool sizes for machining.
Section Analysis
The Section Analysis tool creates a view that cuts through all visible objects in a design to reveal interior details and obscured features.
You select a planar object to define the cut plane, then adjust the distance and angles to position it in the design. You can also flip the section view over the cut plane.
In the Browser, the Section Analysis displays in the Analysis folder, where you can adjust its visibility, edit it, or delete it.
Center of Mass
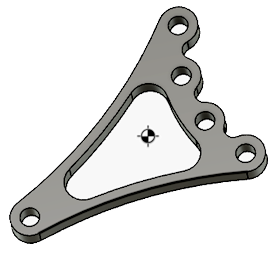
The Center of Mass tool displays a center mark glyph at the center of mass for the selected objects.
You can measure from the center mark to other objects.
The Center of Mass calculation can add to calculation time for other tools. You may want to turn off the visibility of the center of mass node in the browser to exclude it from other calculations. When you turn the visibility back on, the center of mass will be recalculated.
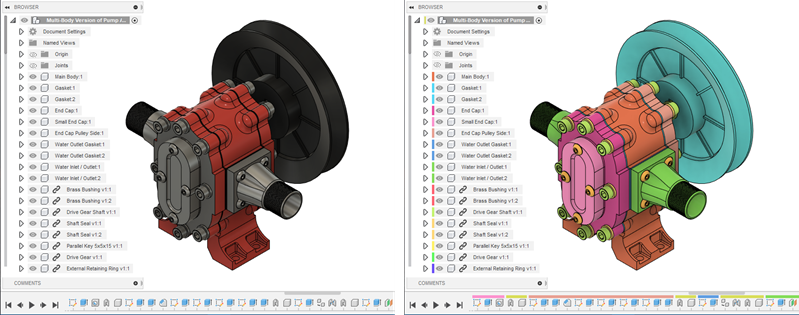
Display Component Colors
The Display Component Colors ![]() tool displays each component in an assembly as a different color to make them easier to differentiate. It hides physical materials and appearances.
tool displays each component in an assembly as a different color to make them easier to differentiate. It hides physical materials and appearances.
Press Shift+N to show or hide component colors.
When component colors are displayed, a different color is applied to the following areas to help you differentiate between components:
- In the Canvas, each body in the component
- In the Browser, the component node
- In the Timeline, each feature that affects the component
- If a feature affects multiple components, it displays the color swatch for each of the components.
Find Similar Components
The Find similar components ![]() tool uses AI to find components in your hub that are similar to a component in your active design. Matches are based on geometry. You can review the results, then open a match in a new design, insert it as an external component in the active design, or replace a component in the active design.
tool uses AI to find components in your hub that are similar to a component in your active design. Matches are based on geometry. You can review the results, then open a match in a new design, insert it as an external component in the active design, or replace a component in the active design.