
Results can be illustrated in the GeoPlan, which gives you the opportunity to replay a run and see how the network changes over the period of the simulation. Using the thematic options, you can monitor the effect of the run on a number of network parameters.
Viewing results
- Let us open the example network if not already in the current window:
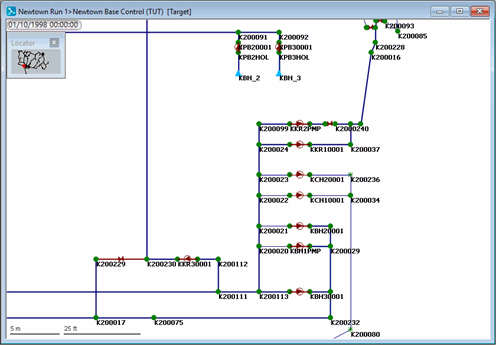
- Open the Runs group and the Newtown Run 1 run. Drag the Newtown Base Control simulation onto the main window. The network is displayed.
- Increase the size of the GeoPlan window and use the
 (Zoom in) and
 (Pan) buttons to zoom in on the part of the network containing the pumping station in the south-west leading to the outfall in the north centre of the network.
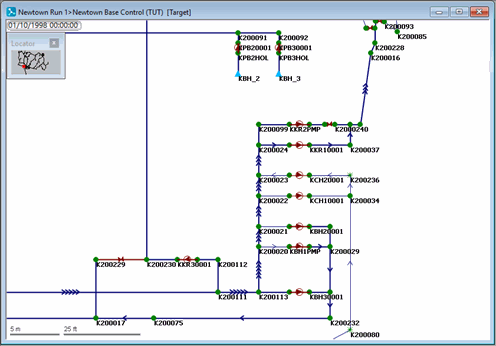
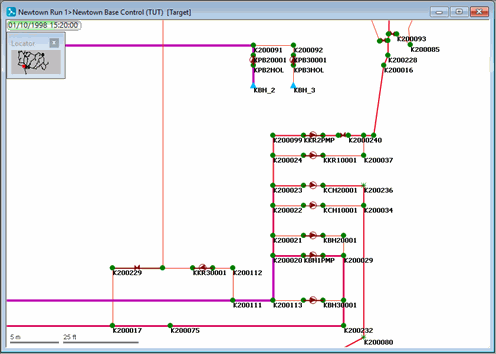
- You can add arrows to the links to indicate the direction and strength of flow.
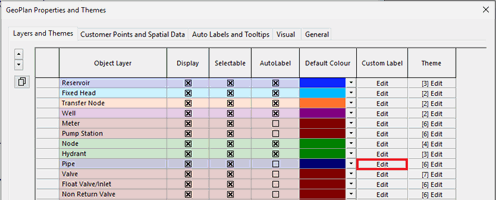
- Right-click the network and select Properties & Themes from the context menu.
- Open the layer theme editor for the Pipe object layer, by clicking Edit under Theme in the Pipe row.
- Create a sub theme named Flow Strength, and select 'sim.flow (Flow)' from the Field list. This parameter is available only if a simulation exists.
- In the Properties list, deselect Line Colour and select Arrows and Arrow Style.
- In the Ranged Themes section, increase the value count to 5.
- In the Arrows column, set the fifth value to 5 and click Auto-Theme in the same column. The Draw Style Preview area shows how the pipes will look for each flow value. Note that negative values in the Arrow column will show as reversed arrows.
- Click OK to close the layer theme editor and the GeoPlan Properties And Themes dialog.
- Click the
 (Play) button on the Replay toolbar to replay the simulation. The level and direction of flow in the pipes is illustrated by the number of arrows on the links. You should be able to see how the flow through the pipes connected to the pumping stations changes as the pumps are switched on and off. The current date and time of the simulation are shown in the top left corner of the GeoPlan window. If you want to play the simulation again, you must first click the
 (Rewind) button.
The other buttons on the toolbar let you control the way in which the simulation is replayed. For example, you can pause the simulation, move forward or backwards one timestep at a time, or jump to the end of the simulation.
(Rewind) button.
The other buttons on the toolbar let you control the way in which the simulation is replayed. For example, you can pause the simulation, move forward or backwards one timestep at a time, or jump to the end of the simulation.
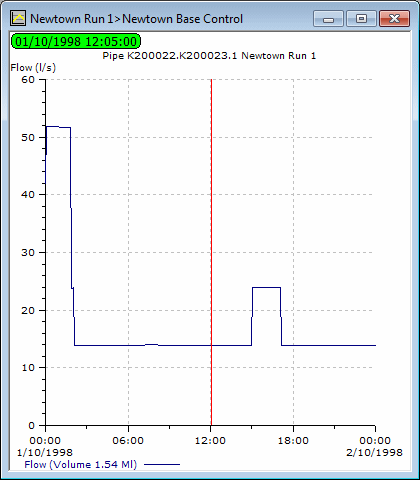
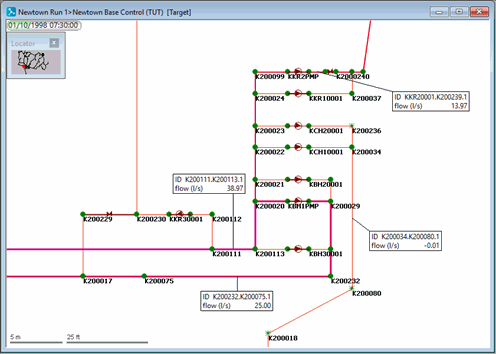
- You can display a graph of the effect of the simulation on various parameters for any point in the network. For example, you can view a graph of the flow through a particular link:
- Click the
 (Graph) button and then a link or node. A dialog is displayed, listing the parameters that are available.
You can select more than one parameter by holding down Ctrl as you click the parameters. Deselect a parameter by clicking it again.
(Graph) button and then a link or node. A dialog is displayed, listing the parameters that are available.
You can select more than one parameter by holding down Ctrl as you click the parameters. Deselect a parameter by clicking it again.
- Select a parameter from the dialog and click OK. The graph is displayed and can be resized.
- The example below illustrates the flow through a pipe during the period of the simulation and shows how the flow fluctuates as the pump is switched on and off. The vertical red line shows the current time in the simulation.
- Click the
- You can hold down the
Ctrl
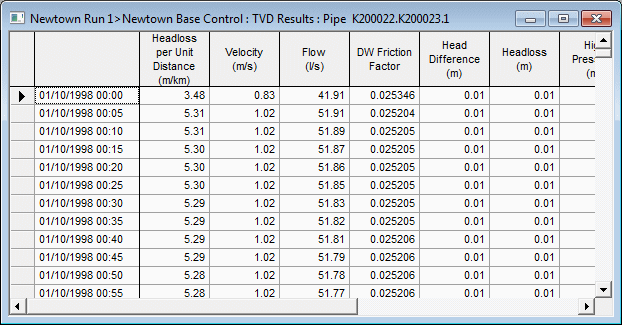
key while clicking a network object with the
(Graph) button to display a grid of results for a particular link or node. Close the grid when you have finished viewing the results.
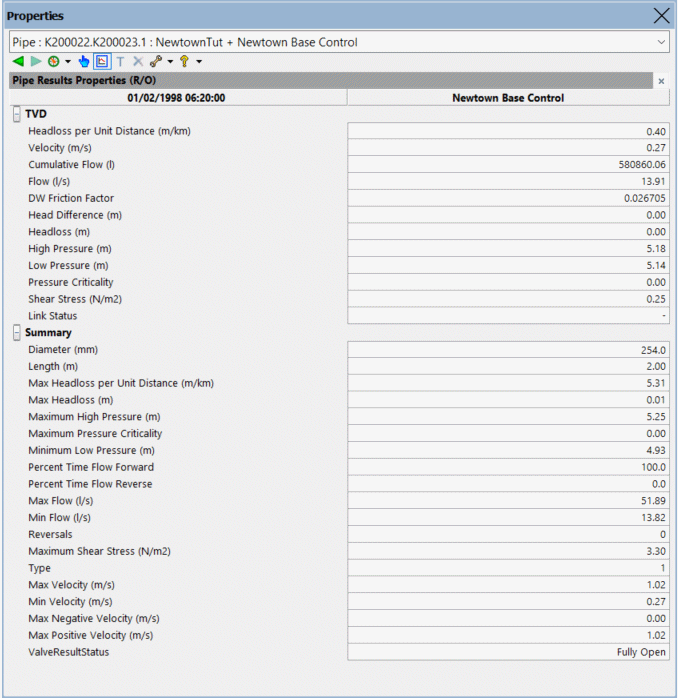
- You can use the
 (Properties) tool to display the properties for a link or node.
- Advance the simulation to a particular time before clicking the object.
- Use the Show Results
 icon on the toolbar to show the results for the selected object at the current timestep.
- It is possible to view the time-varying data on a grid as the simulation progresses:
- Click the
(Rewind) button to rewind the simulation.
- Select Window | Grid windows | Link results.
- Click the Pump Station tab.
- Click the
(Play) button. The values of the parameters change as the simulation progresses.
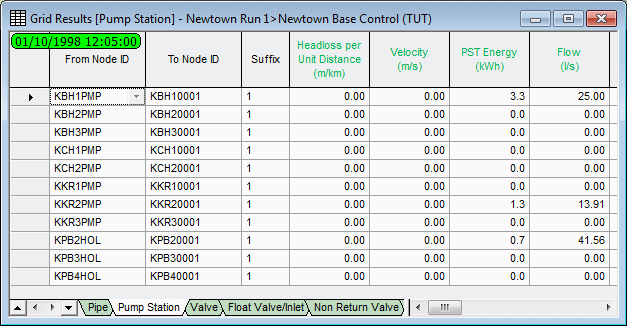
- Close the grid after viewing the results. You can also watch the parameter values for other types of link or (using the Node Results grid) the parameters for nodes.
- Click the
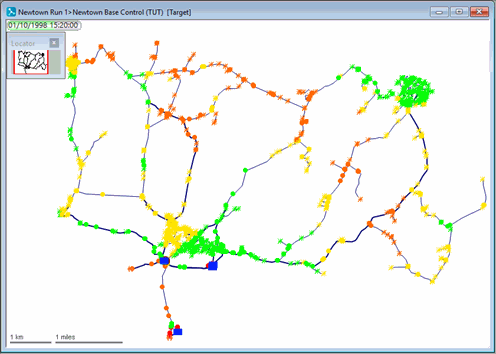
Using themes to illustrate the change in parameters as the simulation progresses
Show the change in flow in each link
- Create a sub theme for the Pipe object layer and name it Flow Change.
- From the Field drop-down list, select 'sim.flow (Flow)'. This parameter is available only if there is a simulation.
- Check that the Absolute Values check box is turned on.
- In the Properties list, make sure Line Colour and Line Width are selected.
- In the Ranged Themes area:
- Increase the value count to 5.
- For the fifth value, select a line width of 5.
- In the Line Width column, click Auto-Theme.
- If the Flow Rate sub theme created earlier is in use on the GeoPlan, disable it by selecting it in the left pane of the layer theme editor and clicking the
 (Enable/Disable) icon on the toolbar.
- Click Apply to see the effect on the GeoPlan.
- Click OK to close the editor, then click OK to close the dialog.
- In the Replay toolbar, click the
(Rewind) button to rewind the simulation and then
(Play) to play the simulation again. The thickness of the lines and their colours illustrates the flow in each link over the period of the simulation.
You can set up the other themes to show what happens at each node .
- Remember that themes are lost when you close the GeoPlan. If you want to save them for future use, click Save on the GeoPlan Properties And Themes dialog then use one of the save options (press F1 for help on the Save Options dialog).
- When using the GeoPlan, you can use the Thematic Key window to disable a sub theme: highlight it in the tree and press
Delete on the keyboard. To re-enable the sub theme, you will have to open the layer theme editor and click the
(Enable/disable) icon on the toolbar.
Set up a theme to display the pressure at the nodes
- Create a sub theme for the Node object layer and name it Node Pressure.
- Choose the field 'sim.pressure (Pressure)'. This parameter is available only if there are simulations.
- In the Properties list, make sure Colour is selected.
- In the Ranged Themes area:
- Increase the value count to 4.
- Enter Values of <, 15 m, 45 m and 60 m. (Applying crosses to the boxes in the Fix column lets you make changes to the values.)
- If you want to, change the default line colour scheme to, for example, red, green, yellow, and orange, by selecting those individual colours from the drop-down tool in the Line Colour column.
- Click Apply to see the affect on the GeoPlan.
- Replay the simulation to see the pressure change across the network.
- Remember that themes are lost when you close the GeoPlan. If you want to save them for future use, click Save on the GeoPlan Properties And Themes dialog then use one of the save options (press F1 for help on the Save Options dialog).
Set up a theme to show pressure contours across the network
- Create a sub theme for the Contour object layer and name it Pressure Contours.
- Choose the field 'sim.pressure (Pressure)'. This parameter is available only if there are simulations.
- Increase the value count to 11, enter 100 m for the last value, then click AutoScale.
- Click
OK to close the editor, then click
OK to close the dialog.
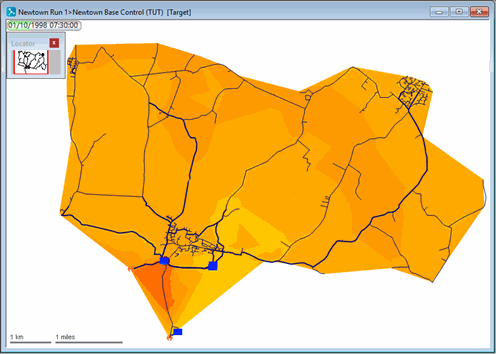
- Replay the simulation.
- Remember that themes are lost when you close the GeoPlan. If you want to save them for future use, click Save on the GeoPlan Properties And Themes dialog then use one of the save options (press F1 for help on the Save Options dialog).
Add labels to show the values for specific links
- Load or create the Flow Change sub theme described previously.
- On the Layers And Themes page of the GeoPlan Properties And Themes dialog, in the Pipe object layer row, click the
Edit button in the Custom Label column.
- On the Content page of the Custom Label Settings: Pipe dialog, tick 'flow (Flow)', then click OK.
- Select the
 (Label) tool.
- Click a link to show (or hide) the label for that link.
- Drag the label to move it to a new position.
- Add labels to additional pipes and move them so that you can see them clearly.
- Replay the simulation. The labels will show the flow through the pipes during the course of the simulation.
You can show several values in each label box by selecting other fields in the Custom Label Settings dialog. You can also add labels for other types of link and for nodes.
-
Labels on the GeoPlan are not saved with the network. If the GeoPlan is closed, all label information will be lost. To save the current label information for reuse: in the Model Group window, right-click the label list group and choose New | Label List, then enter Flow Labels as the name for the new label list and click OK.
- You can turn the display of labels off by selecting Clear all labels from the GeoPlan menu.
Results in other views
These results can also be inspected in the Long section view.
 Back to flowchart

GeoPlan window
Viewing Replays of a Simulation