The results of a simulation can also be investigated by inspecting the log of actions performed during the simulation. The log indicates whether there were any problems during the simulation. If there are no problems, you can look at the data created during the simulation in text form.
The results can be viewed as follows:
- Right-click the Newtown Base Control simulation (which is in the 'Network Run 1' run in the Run Group). Select
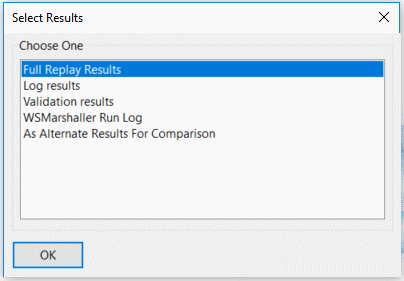
Open as. You are given a list of options:

- Click the 'Log results' option and then
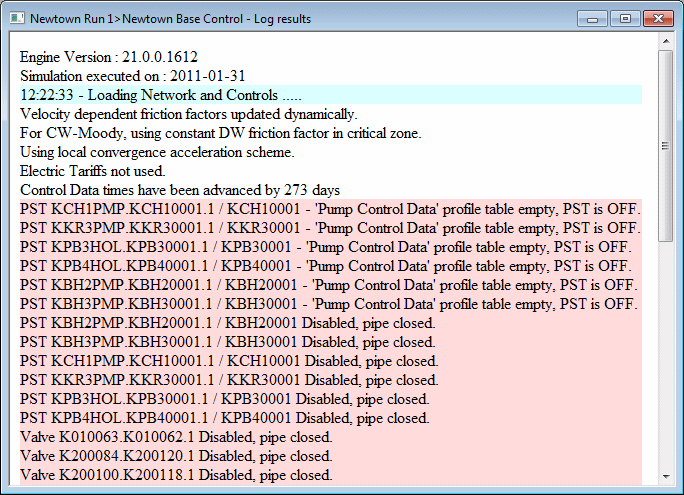
OK. The text window shows a log of the actions carried out during the simulation.

- Use the scroll bars to move around the report and check for any messages that indicate that there may have been a problem with the simulation. If there are any problems in the simulation, the data it produces may not be reliable.
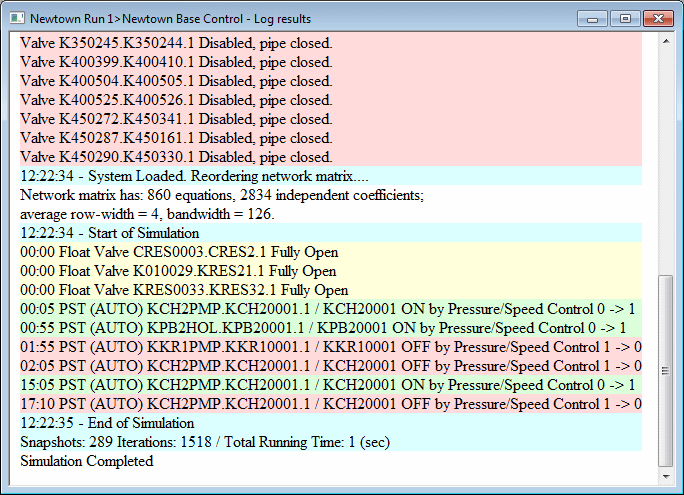
- The background colour indicates the type of message:
- Scroll to the bottom of the log. Pale green messages indicate that a pump has been switched on; pink messages are used when a pump is switched off; yellow messages indicate that a valve is open and blue messages are for general information.

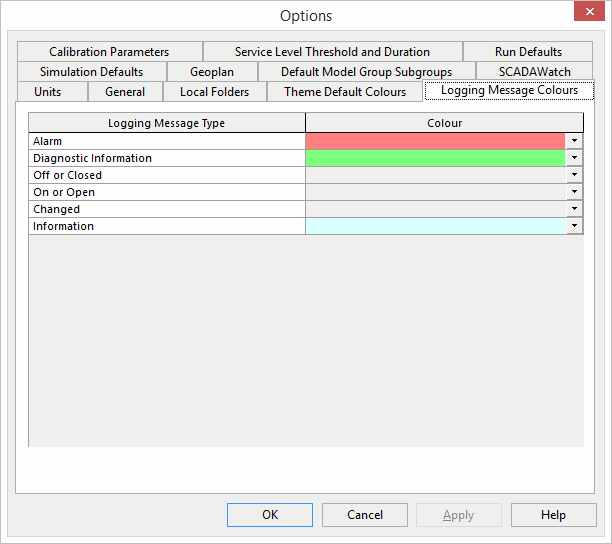
- Select
Tools
 Options and click the Logging Message Colours tab. This shows the colours that are used for each message type.

- Click a colour drop-down to select a different shade from the colour palette.
- Click OK to save the changes or Cancel to leave the colours unchanged.
- After checking the log, close the window.
- Scroll to the bottom of the log. Pale green messages indicate that a pump has been switched on; pink messages are used when a pump is switched off; yellow messages indicate that a valve is open and blue messages are for general information.
You can get a better idea of what the simulation looks like by replaying it in the GeoPlan view.


