
Grillage Analysis
(If not continuing from last section, open "EU Example 10_1 LoadOptimisation.sst" via Help | Tutorials | Open Tutorial Model... from the main menu.)
The next task is to solve all the load cases.
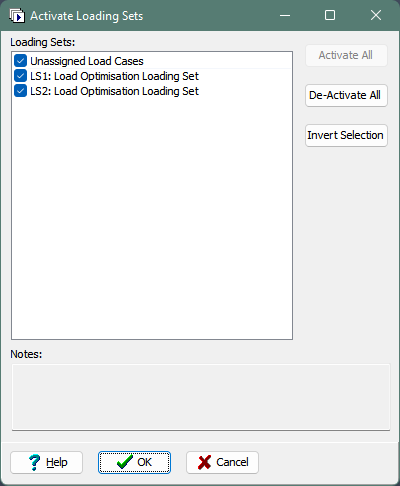
In the main menu select Calculate | Analyse Structure... where the Activate Loading Sets form will open. This allows you to select which loading sets you want to solve. Each time the load optimisation is run, a new loading set is automatically generated for the load cases produced by that run so in this case there will be two cases. The list also includes any load cases not included in a loading set (as Unassigned Load Cases).
Make sure all tick boxes are ticked and click ✓ OK.
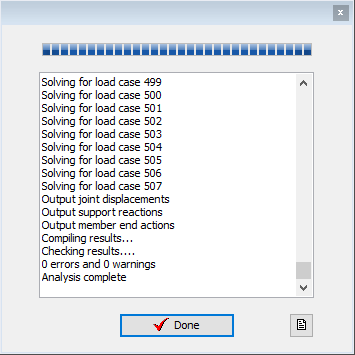
The program will open a form showing the progress of the analysis.
Click on Yes to All for the "Load off structure" dialog.
The following message may pop up depending on the current memory configuration:
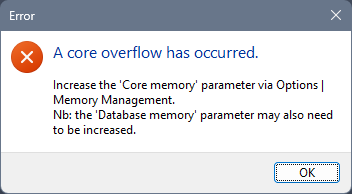
In this case, select the "medium model" option and click ✓ OK, and re-analyse.
Once the analysis has completed, click on the ✓ Done button.
It is good practice to inspect the results produced in the analysis, to check that they make sense, before transferring them to the design beam load tables.
Click on the Results button to open the Results Viewer.
Alternatively the Results Viewer can be opened from the main menu select File | Results....
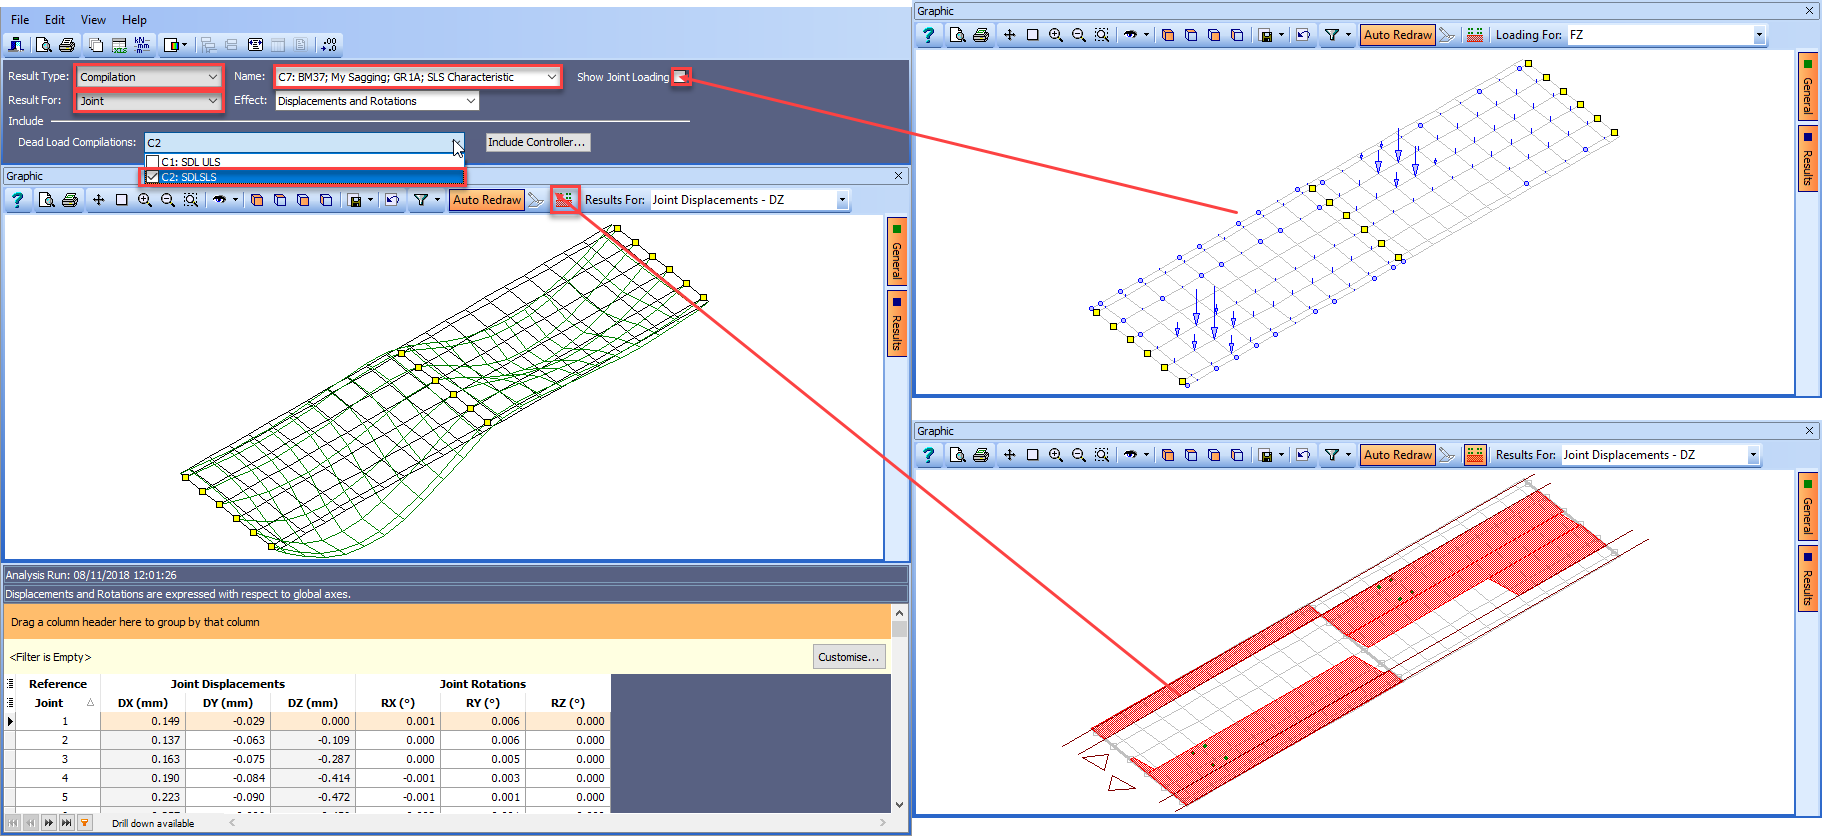
Click on the Result Type drop down and select “Compilation” from the list of options.
In the Name dropdown select compilation C7 (which is an SLS compilation), set the Result for to “Joint” and Effect to “Displacements and Rotations”.
It is required to inspect the results with other permanent load effects at SLS added. (Note that in this model we can only add in SDL because the self weight of the concrete is only included in the Design Beam loads). Click on the Dead Load Compilations dropdown and tick C2. This will add the effects of this compilation to compilation C7 and show the displacements for the load cases in the two compilations applied together.
The load pattern causing this displacement can also be displayed by clicking on the icon in the graphics toolbar, as shown, and the resolved nodal loads from this loading displayed by ticking Show Joint Loading. Filtering can be applied to limit the results to certain parts of the structure, for example, a line of edge members.
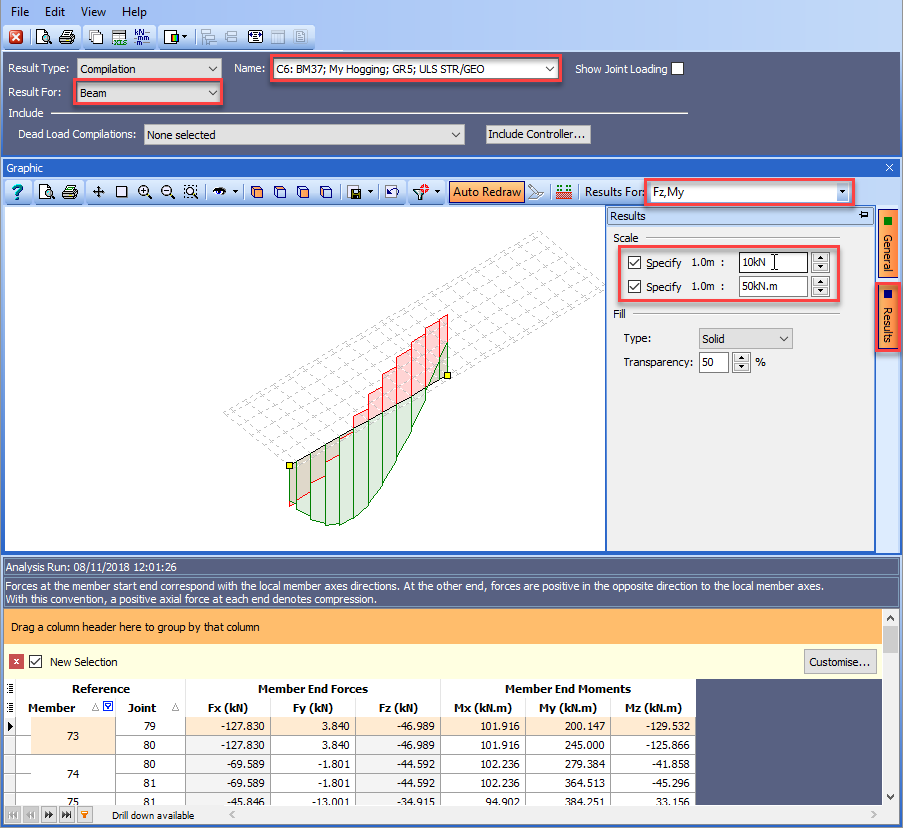
Click on the Result For dropdown and select “Beam” from the list.
In the Name field, select compilation C6.
Click on the Filter toolbar to open the Member Selection Filter form.
Click on De-select all then set Pick Mode to “Longitudinal Beam”.
Change the graphics view to plan and click on the bottom edge beam in span 1.
Click on ✓ OK to close the filter form and change the view back to isometric.
The graphics now shows a plot of the Z member end forces.
We can also overlay a bending moment diagram on the plot.
To do this, click on the Results for dropdown menu on the graphics toolbar (not in the header). You will see tick boxes next to each result type with Fz already ticked.
Tick the My option as well to add the bending moment diagram to the plot.
The scale is a bit small for the plot so move the mouse over to the Results tab on the right hand side of the graphics and tick both the Specify Scale tick boxes.
Enter values of 10kN and 50kNm in the two boxes. The Results Viewer will now look like this:
We can also look at the joint displacements for all compilations for the centre joint of span 1.
To do this, change Result For to “Joint” then click on the Edit | Multiple Results Selection menu item. This will open the Multiple Results Selection and Include Controller form.
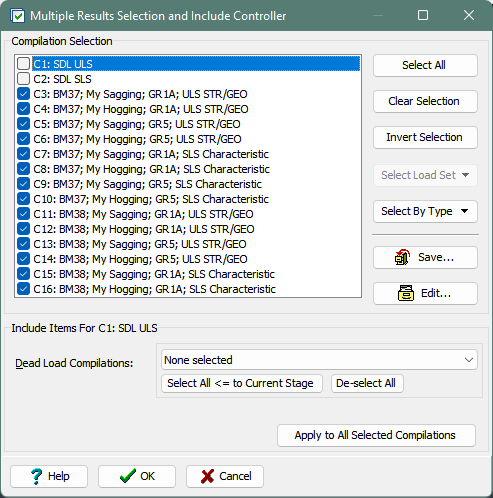
Click on the “Select All” button then un-tick the first two compilations.
Click on ✓ OK to close the form and display the displacements for the selected compilations. All the displacements are there but they are grouped by compilation.
If it was required to establish the max negative DZ displacement for one particular node over all live load compilations (without having to create an envelope), say node 46, then the table could be ungrouped and the table sorted so the max was at the top.
Drag Including Dead Load Compilations and Compilation Name off the orange bar to un-group the results.
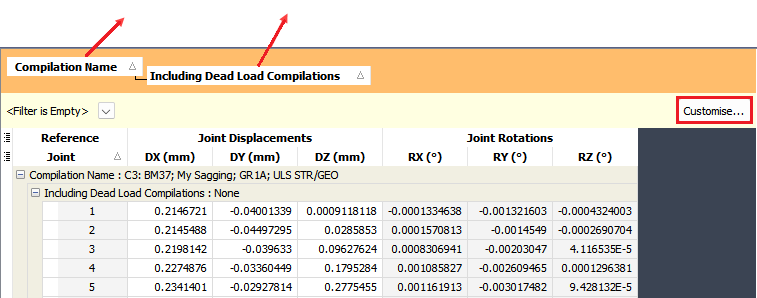
Click on the Customise button at the top right of the results table.
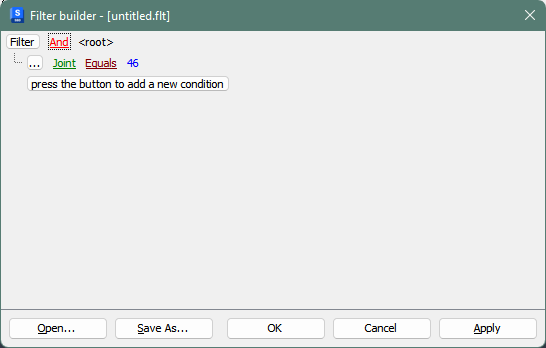
On the Filter Builder form click on the button marked press the button to add a new condition then click on the green text and select “Joint”.
Click on the blue text which says 'empty' and type “46” then click on the ✓ OK button.
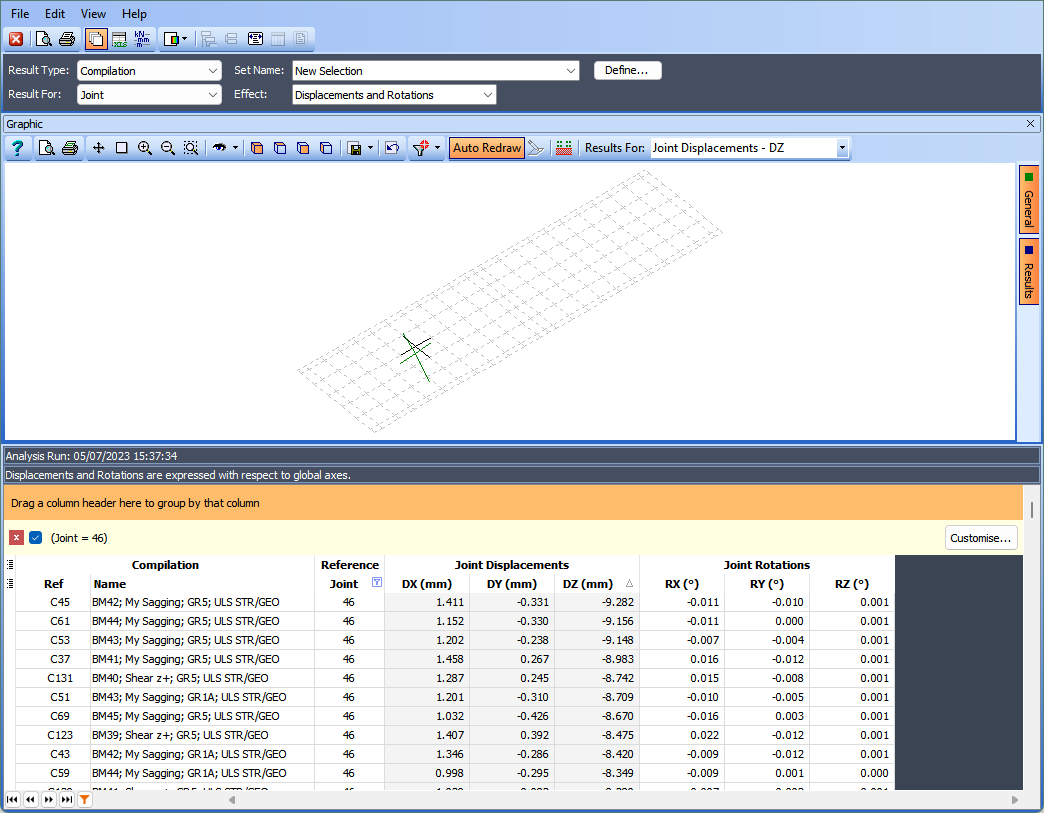
Set the Results For: drop down menu on the graphics toolbar to “Joint Displacement - DZ”.
Click once on the DZ column header to sort the list from low to high, then scroll to the top to see the maximum negative displacement for joint 46.
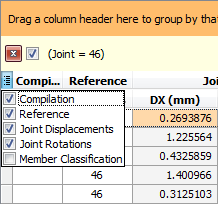
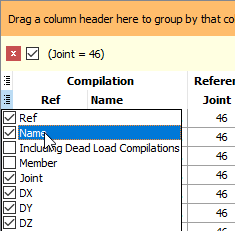
To see which compilation produces this displacement, additional columns can be added to the table. Click on the menu option to the left of the Reference heading in the results table.
Tick “Compilation” then click on the menu on the row below and tick “Name” and “Ref”.
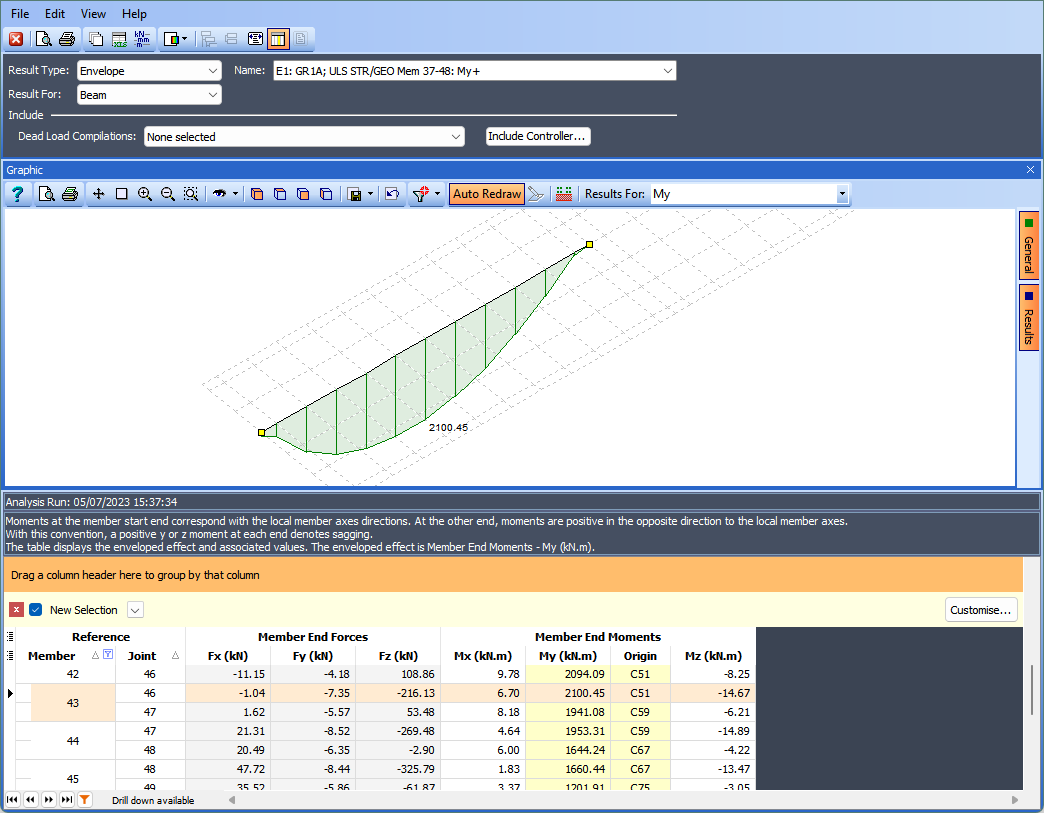
The load optimisation was carried out for one longitudinal beam so the program automatically created bending moment envelopes for that particular beam.
To see these enveloped results, click on the Result Type drop down and select “Envelope”. The Name field should show envelope E1.
Click on the Filter button then De-select all, set Pick Mode to “Longitudinal Beam” and click on the inner beam just above the centre of the deck in span 1.
Click on ✓ OK to close the filter form.
Put your mouse over the Results tab on the right of the graphics and untick the two Specify Scale tick boxes.
Put your mouse over the General tab and tick the Result tick box. This will show the maximum My moment.
Finally, close the Results Viewer.
Save the file as “My EU Example 10_1 Load_Analysis.sst”.