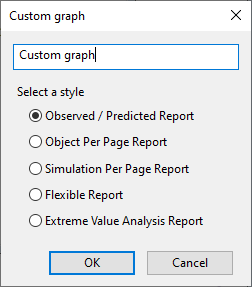
This dialog is displayed when a new
Custom Graph is created from the tree view in the
Explorer Window or when the Results Custom graphs option is selected from the
InfoWorks ICM main menu:

- Enter a custom graph name in the text box
- Select a style by checking the appropriate radio button
- Click on OK
The new custom graph object is added to the Explorer Window tree view. The colour of the icon depends on the style selected in the above dialog.
See Custom Graph View for more details on the specifying the information required in order to generate a custom graph.
Note that Object per Page and Simulation per Page report are not currently available in for SWMM networks.
