
Displayed from the Node Demand Page of the property sheet for either a simple node or a reservoir.
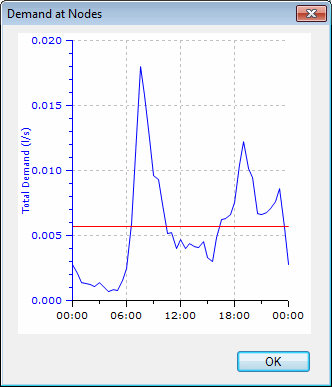
Select one or more User Categories in the grid on the Node Demand Page (click the left hand cell of the row to select the row) and then use the Produce Graph button to display a graph of demand.
The current demand diagram is normally the last demand diagram that was the current active window and which is still open in InfoWorks. The current active window in any Microsoft Windows application has a differently coloured title bar to all the other windows. In the default colour scheme, the active window title bar is blue, all other windows have a grey title bar.
If you close the current demand diagram:
- the software will clear its pointer if no other demand diagram is open
- if one other demand diagram is open, the pointer will point to this configuration
- if more than one demand diagram is open, and closing the current one makes another the current active view, then that configuration becomes current
- if more than one demand diagram is open, and closing the current one does not make another the current active view, the software sets its pointer to the first view on its internal list.
The current demand diagram is used to fill in the drop-down list of IDs when you edit demand data for nodes. It is also used in static demand allocation.
To ensure that you know which is the current demand diagram, make the correct configuration the current active window before moving on to do other editing.
If more than one row is selected in the grid, the graph shows the sum of all selected demands.
Related Topics