
This report displays a summary of sustainability analysis results for the network.
The report is opened by selecting Results | Grid reports | Flow, system and global summary results and then completing the Grid Report dialog, choosing Sustainability (CO2) Simulation Summary as the report type.
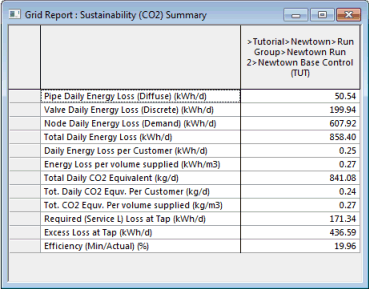
Show image
| Item | Description |
|---|---|
| Column header | Contains the full database location of the simulation (model group, run group, run, simulation). May also contain the title of the data in the column as the final element. |
| Data |
Pipe Energy Loss (Diffuse): Daily rate of energy loss in pipes in the network due to friction and minor losses. Valve Energy Loss (Discrete): Daily rate of energy loss at control valves. Node Energy Loss (Demand): Daily rate of energy loss at nodes due to customer taps. Total Energy Loss: Total daily rate of energy loss from pipes, valves and nodes. Energy Loss per Customer: Daily rate of energy loss per customer. Energy Loss per volume supplied: Rate of energy loss per unit volume of water supplied. Total CO2 Equivalent: Total daily rate of energy loss expressed as carbon dioxide equivalent. Tot. CO2 Equv. Per Customer: Total daily energy loss per customer expressed as carbon dioxide equivalent. Tot. CO2 Equv. Per volume supplied: Total daily energy loss per unit volume of water supplied expressed as carbon dioxide equivalent. Required (Service L) Loss at Tap: Daily energy loss at customer taps assuming minimum service pressure entered on the Grid Report (Time Varying) dialog. Excess Loss at Tap: Difference between Node Energy Loss (Demand) and Required (Service L) Loss at Tap. Efficiency (Min/Actual) (%): Water efficiency as a percentage calculated as: Required (Service L) Loss at Tap / Total Energy Loss |
| Context menu option |
Copy: Copies the value(s) of the selected cell(s) to the clipboard. Several cells / rows / columns can be copied simultaneously. |