Reporting
Note:
For users with Fusion connected sites, references to the 'Items' workspace should be the 'Components' workspace.
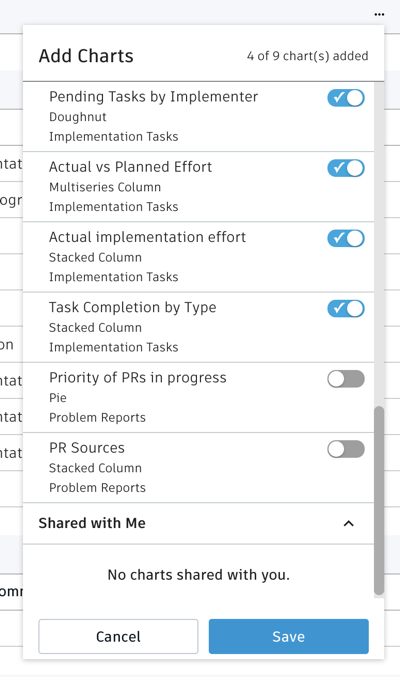
The following charts are included in this template to enable easy progress tracking:
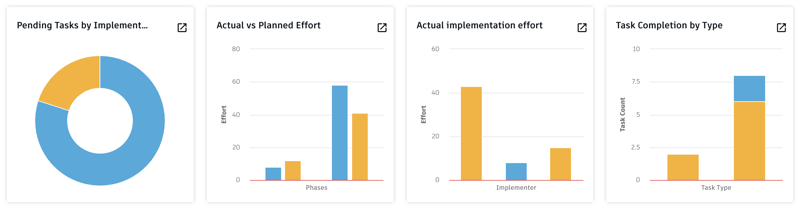
- Pending Tasks by Implementer reveals the number of non-completed tasks by Implementer
- Actual vs. Planned Effort compares the total Actual Effort of all tasks within a phase against the matching total Planned Effort.
- Actual Implementation Effort counts the total effort by Implementer and splits it by task type
- Task Completion by Type indicates the percentage of tasks being completed by Task Type
Users can toggle these reports on and off in the Landing Page: