The purpose of the tutorials is to ease new users of InfoDrainage into the software. There is a brief overview of the software, covering all the basic aspects of the user interface, followed by a more in depth tutorial. The tutorial itself is designed to give you hands-on experience of working with InfoDrainage. It has been created to demonstrate key features and benefits of the program by running through a simple case study, covering aspects of analysis and design of sustainable drainage networks. You should use the tutorial in conjunction with the program, referring to the results on screen where necessary. It is worth noting that results will vary slightly depending on how the structures are placed in comparison to the model tutorial. Due to this reason there are model files that can be opened at the beginning of each tutorial chapter to make sure that you can follow along with the tutorial. Images from the program have been used to illustrate the main points of the procedure.
Introduction to the InfoDrainage User Interface
We will begin by getting familiar with main aspects of the user interface.
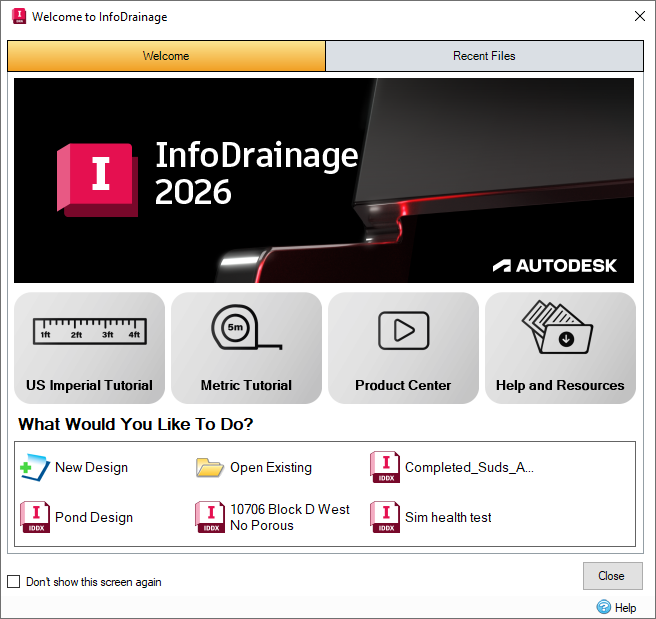
Welcome Screen
Once a license is setup this is the screen we see when opening InfoDrainage. Within the Welcome tab is the ability to access the tutorials (both Metric and Imperial). There are also links to recent webinars, as well as our Help and Resources webpages. The What Would You Like To Do? window displays other actions you can take, such as starting a new design or opening an existing file. Recent Files that have been opened are also listed in this window to allow users to jump back into projects they have been working on. The Recent Files tab lists the recent files in more detail, showing the file path, as well as the date that the document was last saved.
Main Screen
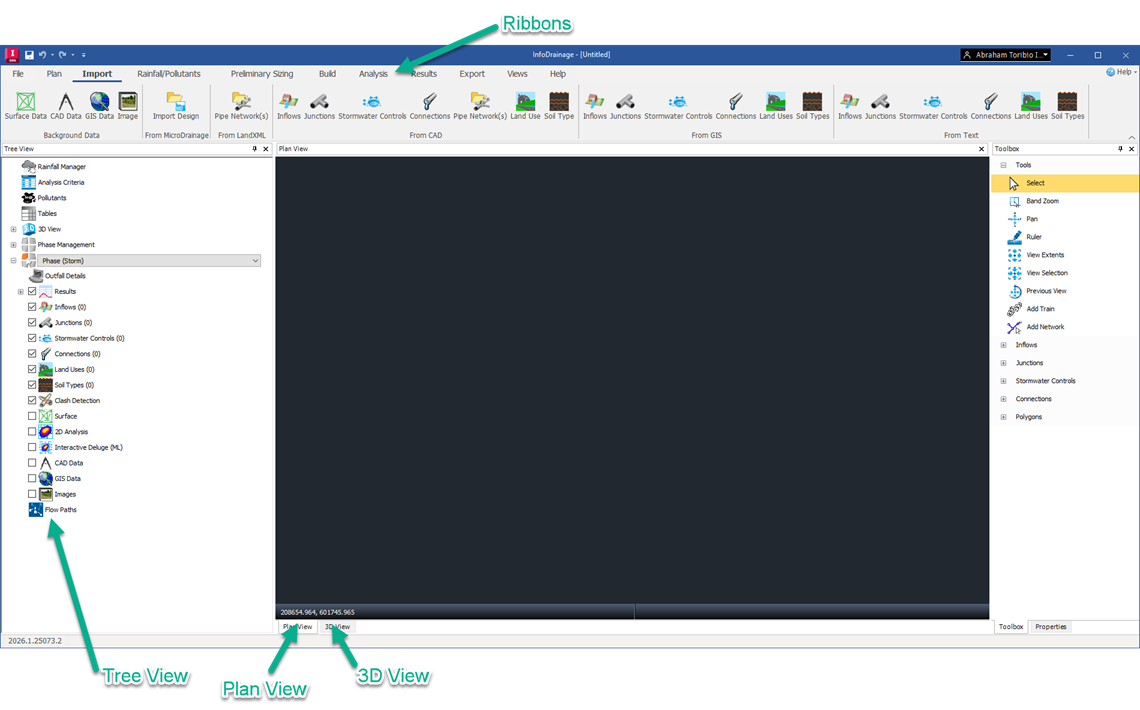
This is the main screen of InfoDrainage that is visible when creating and analyzing networks. The main parts are seen below:
Plan View
The area in the center of the screen is reserved for the 2D Plan View – it shows the graphical layout of the site and it is the main window for creating and editing drainage designs. The location of Stormwater Controls (SWCs), Inflows, Inlets and Outlets can be specified graphically as well as drawing SWC areas and connecting items with Connections.
3D View
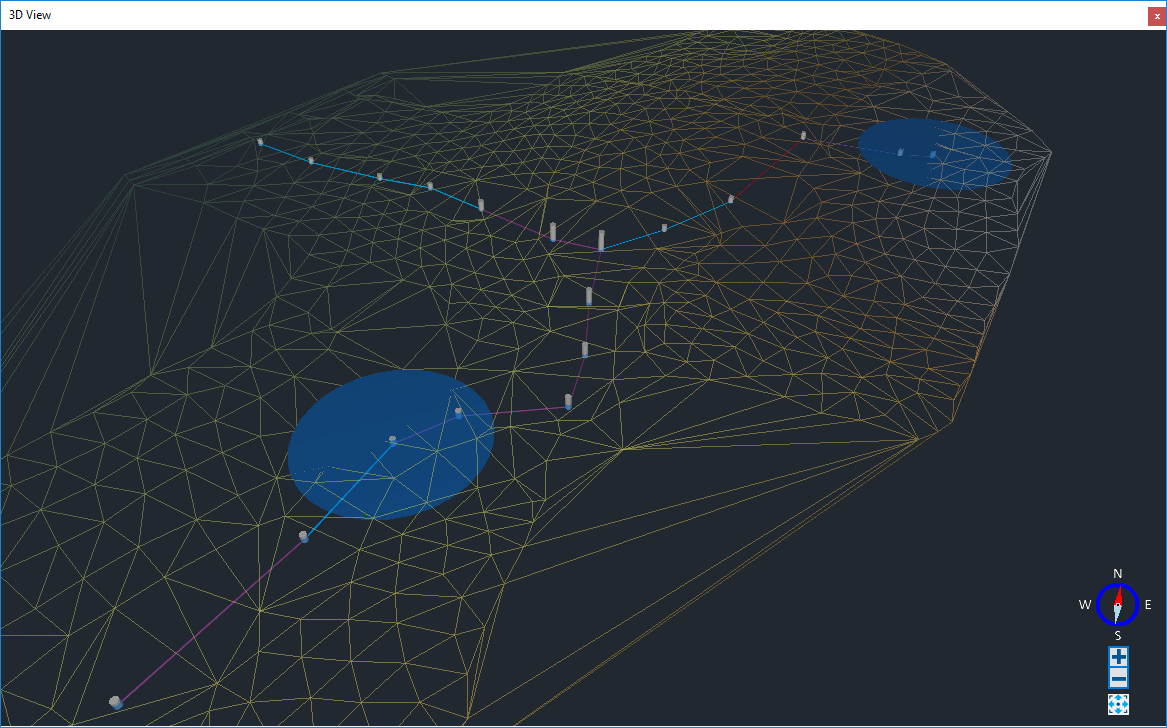
The 3D tab displays the three dimensional representation of the Plan View. It shows the locations and dimensions of Stormwater Controls (SWCs), Junctions, Connections, and Surface Data in three dimensions.
File Menu
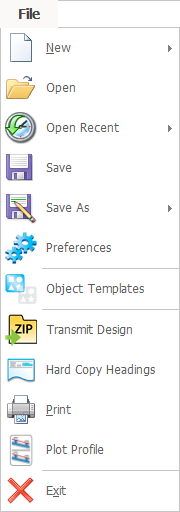
From here we can start a new project, open an existing one, save a project, print it and exit from InfoDrainage. For more information about this topic, go to File Menu.
Preferences
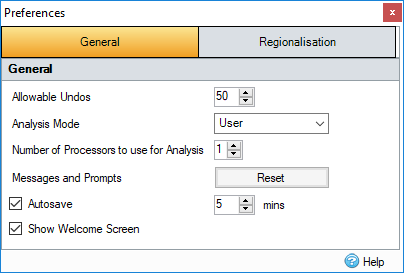
The Preferences settings allow designation of units, color theme and general software operation settings. For more information about this topic, go to Preferences.
Object Templates
Within InfoDrainage, you can import, create, and export object templates that can be transferred to another computer with InfoDrainage installed. The template items then become available in the Build menu and the Toolbox. In this model, the Toolbox includes the default Template items, as well as Templates set up specifically for this tutorial. Once we have set up Stormwater Controls that comply with our local standards, we can add them to a Templates file by right-clicking an item and selecting Add to Templates. For more information about this topic, go to Object Templates.

- Under the File menu, select Object Templates. You will see the Object Templates where we can View, Import, Merge, Edit and Save templates.
- If you highlight a Template Group along the left hand side of the form, you get the option to Add a new template, which will start off as a blank copy of the selected item. By right-clicking an existing Template, a Duplicate can be made, in order to make changes to existing Templates. Adding several Templates that have the same name will add a suffix number at the end of the item name. The example below shows that we have saved the Ponding Area depth, Side Slope, Freeboard and Slope contained in the Template. In the Filtration Layers tab, you will also see the layers setup as part of the template.

- Once you have created a Template, you can save the Template (*.idtx) file for use in other designs. Further, you can Open or Import another Template file for use in your Design. Open will replace any pre-existing Template data, whereas importing a Template file will provide you with a list of Templates to Import to your Template list and merge the options available.
- A Default Template File can be saved as part of the Project Template.
Transmit Design
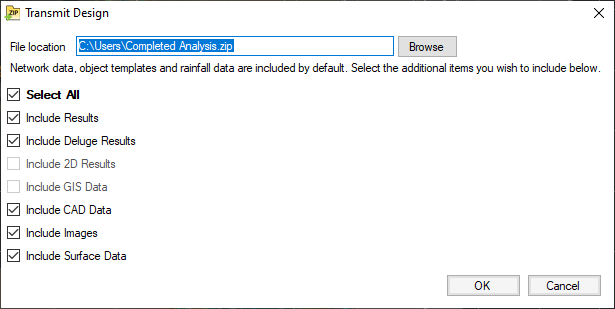
This allows the user to save a zip file with all the associated files together suitable for transferring to a colleague or client, or to the Innovyze Help Desk. The user can choose to include Results, CAD data, GIS data, Images or Surface Data. Network data and Rainfall data will be included by default. For more information about this topic, go to Transmit Design.
Hardcopy Headings
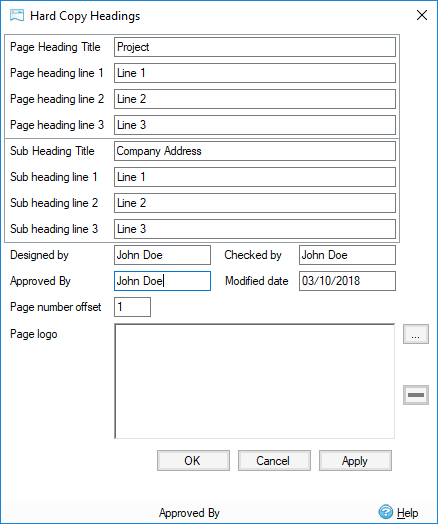
This is a very useful tool to include the name of the designer and checker and specify the headings which will be printed at the top of each printed page. A user defined logo can be added at the top of each page by browsing for an appropriate image file. For more information about this topic, go to Hard Copy Headings.
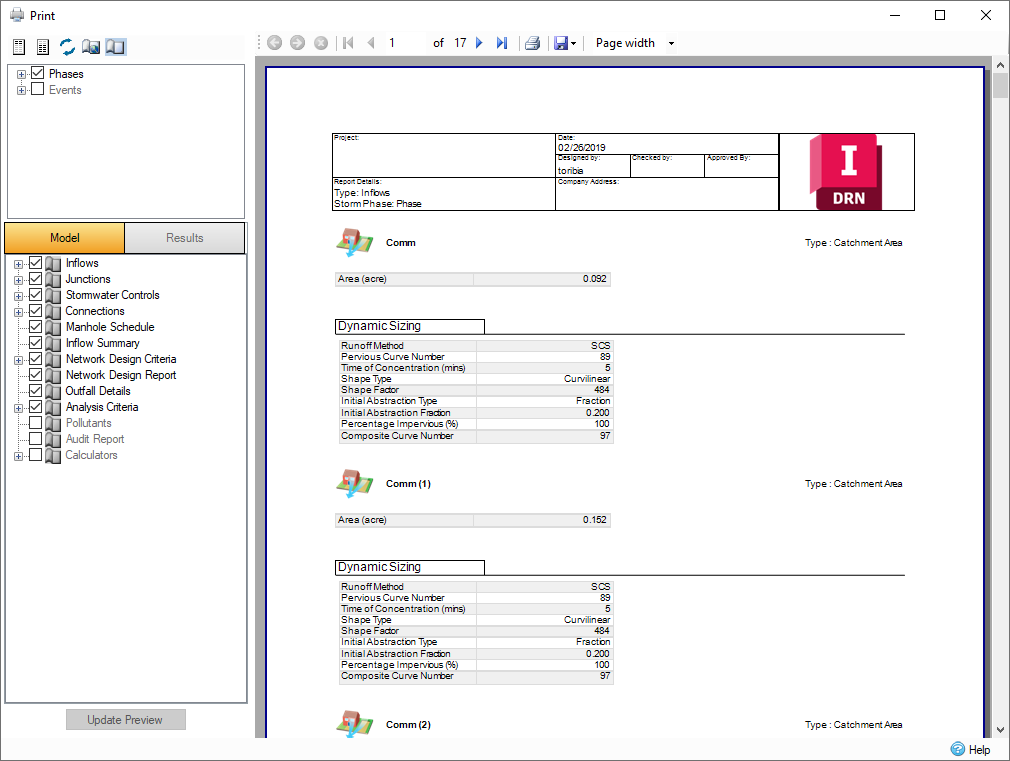
The Print tool displays the preview of the document, as well as different options available when outputting the model to a printer or file. You can modify the settings using the toolbar in the upper pane of the dialog. For more information about this topic, go to Print.
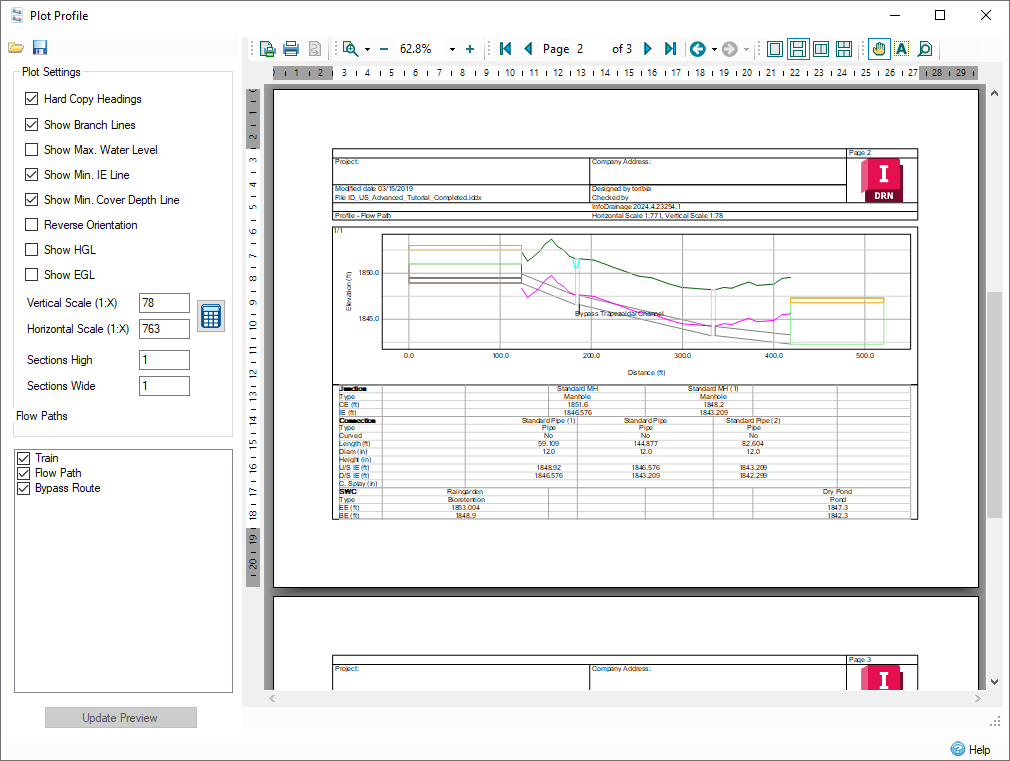
Plot Profile
The Plot Profile tool allows you to preview all of the availableFlow Paths Profile and how they will be plotted. You can select the desired scales and output the plots to a printer for distribution. For more information about this topic, go to Plot Profile.
Ribbons
The ribbon tabs across the top of the screen give a simple, ordered approach to the typical workflow of managing site data and building a drainage scheme. There are quicker ways to access your data, but the ribbon tabs are a good way to begin.
Plan Ribbon
Navigate and manipulate the 2D plan view (in the middle of your screen). For more information about this topic, go to Plan Ribbon.

Import Ribbon
Import and create data that describe your site. For more information about this topic, go to Import Ribbon.

Rainfall/Pollutants Ribbon
Import, create and manage rainfall records and pollutants. For more information about this topic, go to Rainfall Ribbon.

Preliminary Sizing Ribbon
Use a range of preliminary sizing tools to quickly assess your site and complete sizing calculations. Automatically size your pipe networks and create Full, HEC-22, or Methode de Caquot pipe sizing reports. Quick and handy analysis of runoff across the site and easy estimates of the treatment volume needed. For more information about this topic, go to Preliminary Sizing Ribbon.

Build Ribbon
Create a new design using individual items or as a treatment train – this is the way we generally refer to the sustainable drainage network that is to be designed using InfoDrainage. For more information about this topic, go to Build Ribbon.

Analysis Ribbon
Validate the design of the treatment train (are all essential data fields complete?) and analyze rainfall and pollutant flow through the treatment train. For more information about this topic, go to Analysis Ribbon.

Results Ribbon
Tabular and graphical views of the analysis results. For more information about this topic, go to Results Ribbon.

Export Ribbon
Export data from your site to a range of formats. For more information about this topic, go to Export Ribbon.

Views Ribbon
Views Ribbon provides options to open or select different windows in InfoDrainage as well as an easy way to Change Layout of the windows and configure the Display Settings. For more information about this topic, go to Views Ribbon.

Help Ribbon
InfoDrainage works best with online help – so long as you are connected to the internet. If not, offline help is available. For more information about this topic, go to Help Ribbon.

Tree View
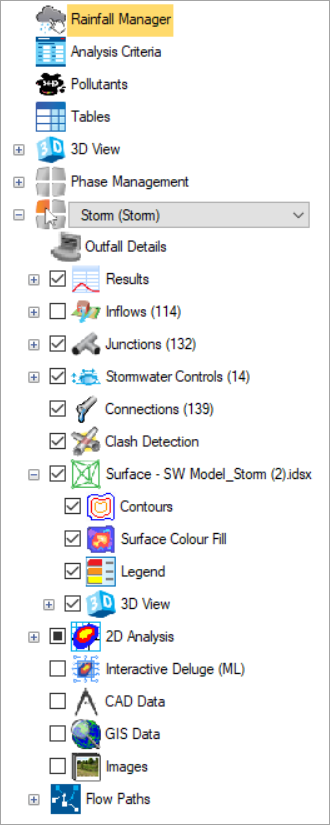
On the left-hand side of the screen you can see the Tree View. From here you can directly access and manage all the elements of your site and design, rather than finding them on the ribbon menu. This allows the project to be quickly navigated.
Just a quick word about Phase Management. This allows the project to be separated into various phases or scenarios. Perhaps the most likely division is between pre-development and post-development. But the site may be developed in successive phases. And the treatment train could be built-up in successive phases.
This can also be used to compare alternative designs, and test their relative effectiveness.
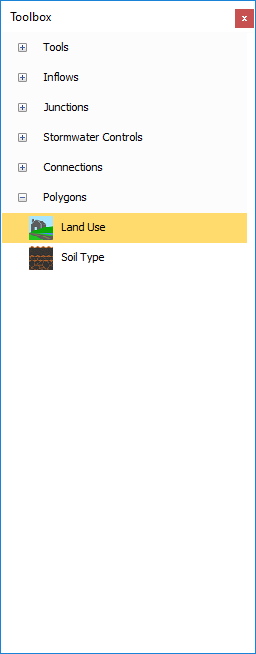
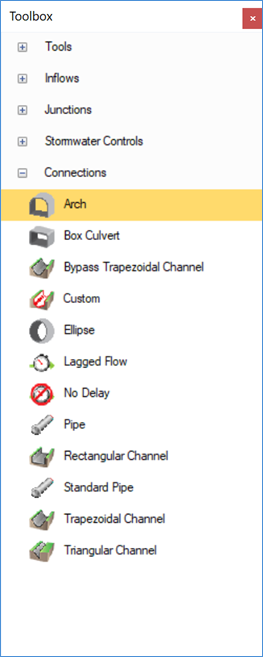
Toolbox
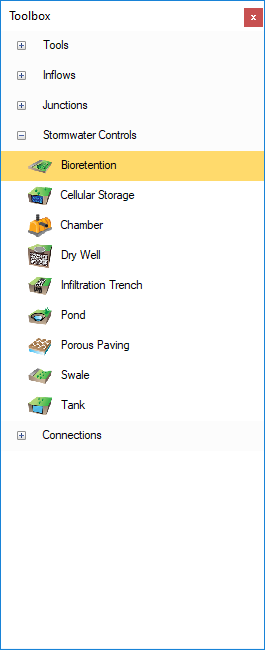
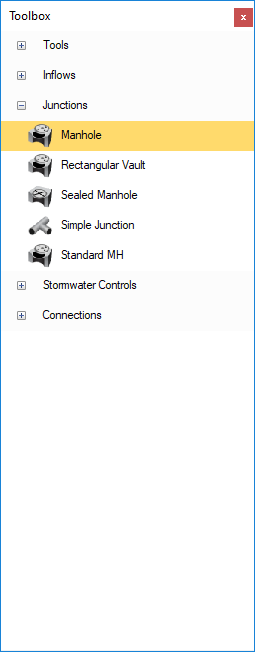
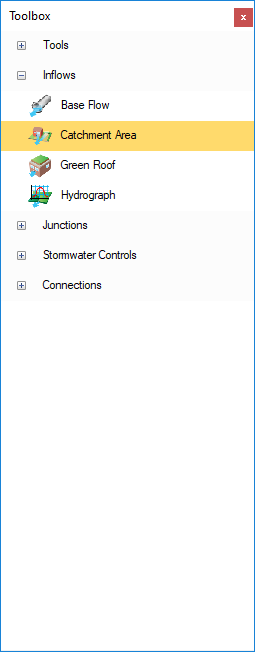
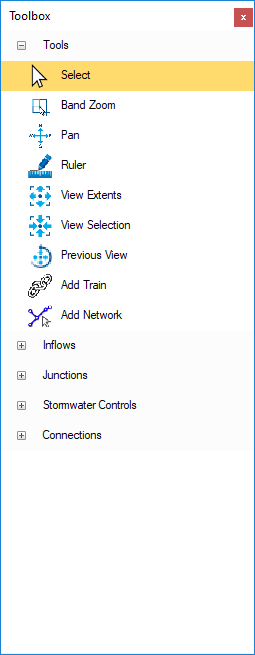
On the right-hand side of the screen we have the Toolbox which shows the functions and items that allow the creation of drainage schemes on the plan view. A default set of items are supplied with the software; additional items can be added through Object Templates.
An item can be added to the plan graphically by clicking and dragging the item to the required location.
Properties
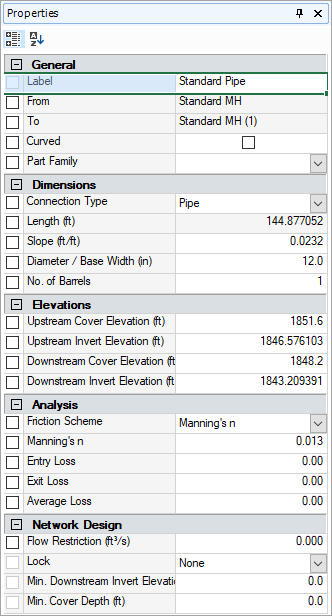
The Properties tab shows the details of the currently selected item and allows values to be changed quickly without the need to visit a detailed data form.
Shortcuts
There are many shortcuts available in the application. Here are examples of some of them:
Ctrl+A = Select All
Ctrl+Z = Undo
Ctrl+Y = Redo
Ctrl+S = Save
F2 = Rename
F4 = Properties
F5 = Results