Sample Dashboard
The sample dashboard serves as a reference for how to utilize the Autodesk Data Connector for Power BI. A sample dashboard in Power BI is a pre-built visualization that provides a starting point for creating your own data-driven reports. It is a template that showcases how to use Autodesk Data Connector for Power BI and the Viewer features effectively. These dashboards are typically created using sample datasets and provide a starting point for users to learn about capabilities of the Connector and explore different data visualization techniques.
Important: This is a sample dashboard for demonstration purposes only. It is not intended for direct implementation or reuse. It does not have a refresh function, trying to refresh it may cause errors.
After installing the Connector, navigate to C:\Users<UserName>\Documents\Power BI Desktop\Sample Dashboard\Sample Dashboard.pbix file.

Open the file. Power BI will load the sample dashboard.


Dashboard Overview:
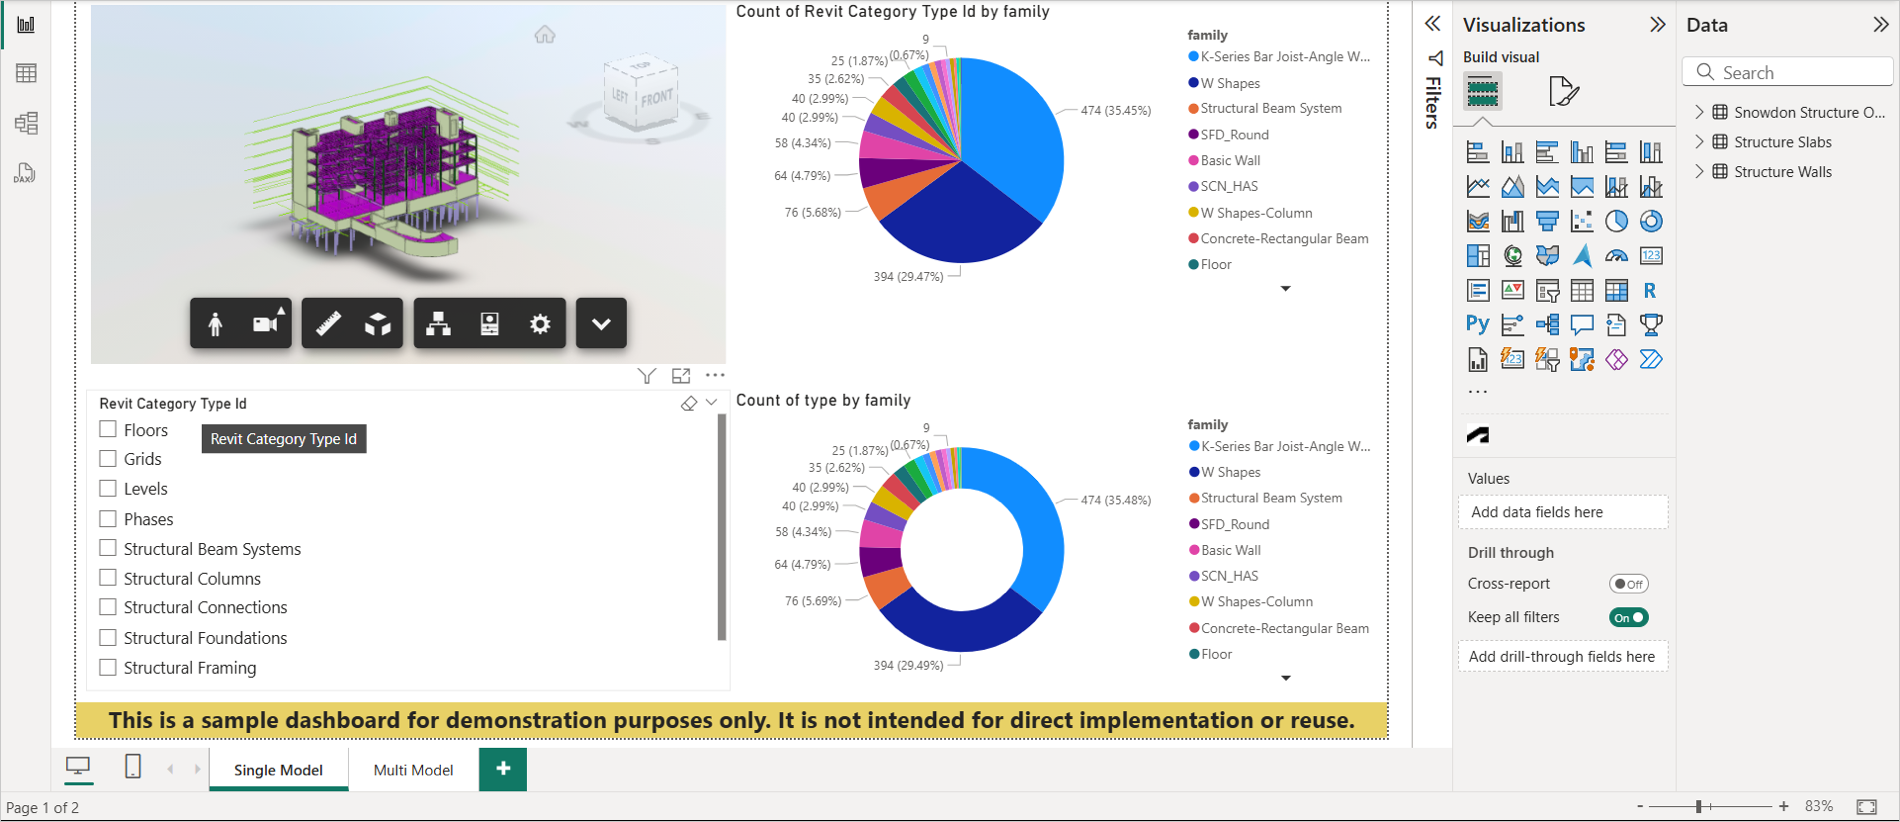
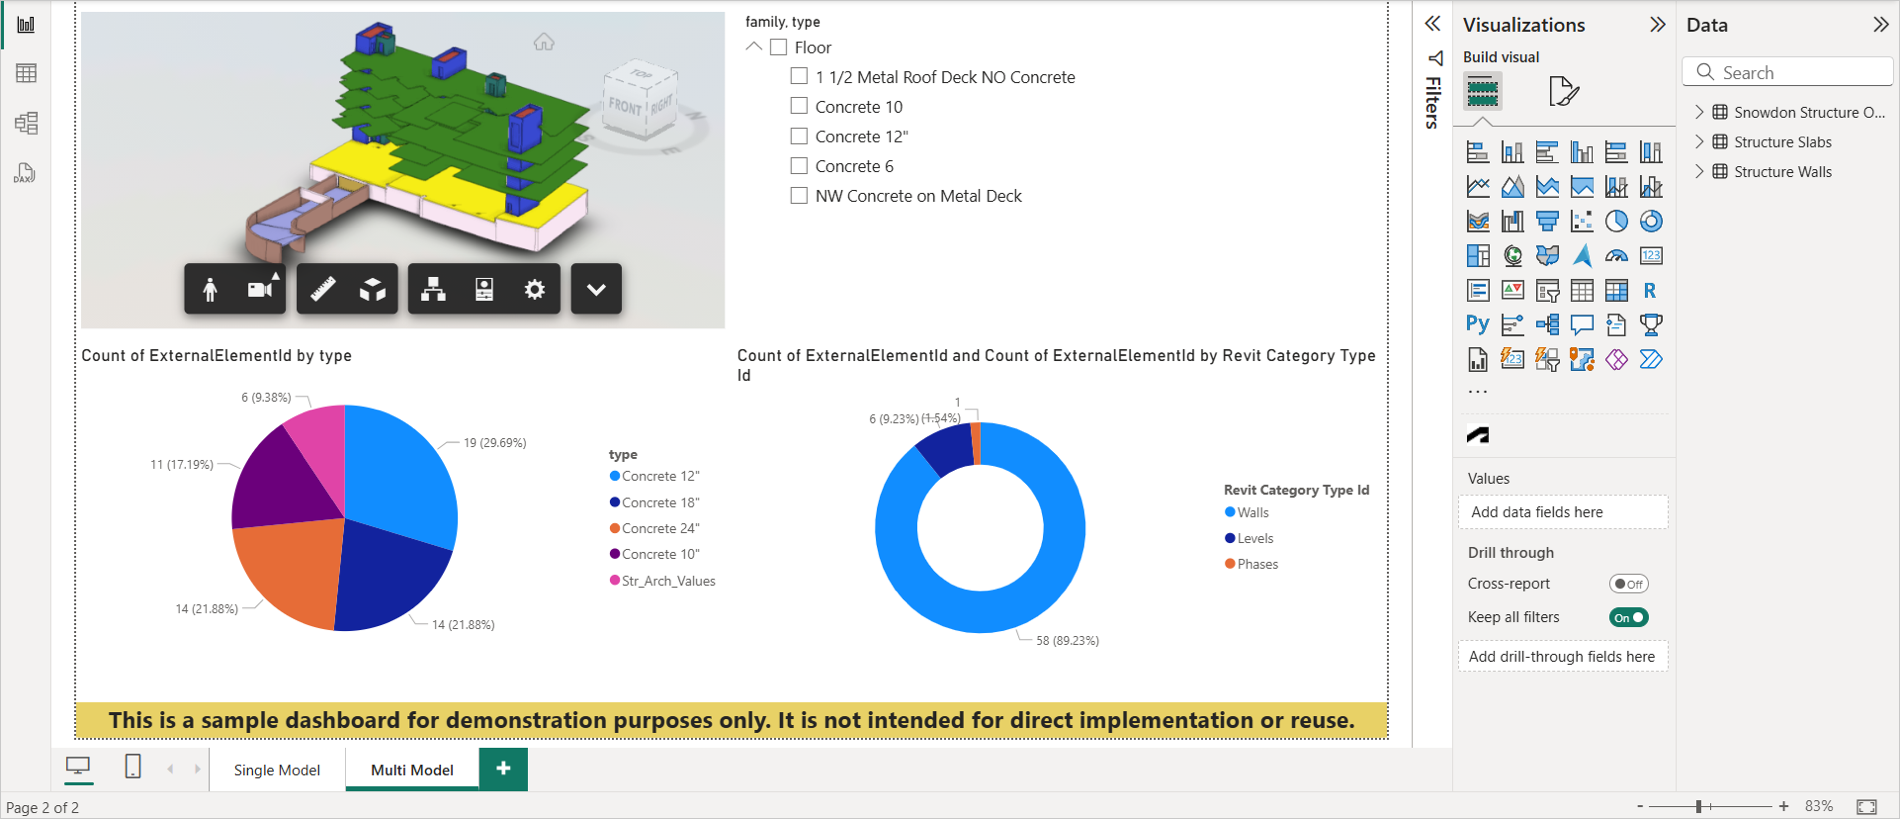
- Data Source: This dashboard incorporates data acquired through the Data Connector for Power BI, specifically targeting the "Snowdon Structure Only," "Structure Slabs," and "Structure Walls" datasets.
- Viewer: The "Single Model" page displays the "Snowdon Structure Only" dataset within the Data Connector Viewer, while the "multi-model" page presents both the "Structure Slabs" and "Structure Walls" datasets in the Data Connector Viewer.
- Slicer Usage: On the "Single Model" page, a slicer is positioned below the Data Connector viewer on the lower left to filter elements. Conversely, on the "multi-model" page, a slicer is located in the upper right corner adjacent to the Data Connector viewer for element isolation.
- Pie Chart: The "Single Model" page showcases a Pie chart on the right, utilizing Power BI's built-in visual tools to depict the distribution of various values. The "multi-model" page features a Pie chart in the lower left corner.
- Donut Chart: Both pages include a Donut chart in the lower right corner, another Power BI native visual, representing the distribution of various values.
