
Learn how to display graphs of individual live data points or of all the live data points in a zone.
- Selecting one or a number of rows in the Live Data Point view, Live Data Feed view, or Live Data Composite Feed view, then choosing Graph selected live data points from the context menu. This displays the graphs of individual live data points.
- Selecting one or a number of rows in the Live Data Point view, then choosing Graph concentrations from the context menu. This displays the graphs of individual live data points.
- Selecting one or a number of rows in the Live Data Zone view, then choosing Graph selected zone from the context menu. This displays the graphs of all live data points in a zone (flow and pressure data only).
- Selecting Graph in the object properties window of Live Data Point, Live Data Feed, and Live Data Composite Feed.
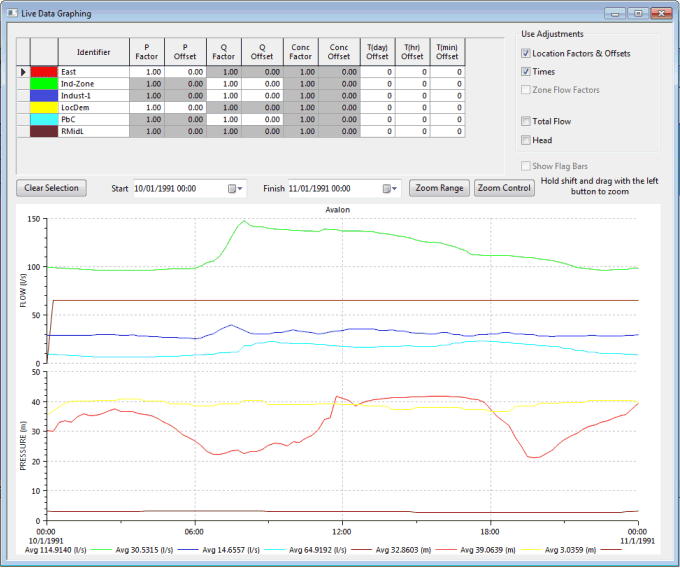
| Item | Description | ||||||||||
|---|---|---|---|---|---|---|---|---|---|---|---|
| Factors and offsets table |
At the top of the dialog is a table of all the multiplication factors and offsets applicable to the data. These are the same fields as shown on the Live Data Point view. You can change these factors and offsets and view the effect on the graph. When you make a change, the changed value is saved back into the database as soon as you move off the cell, so you can see the change immediately on the Live Data Point view. These factors and offsets are not applicable to Live Data Feed view and Live Data Composite Feed view. These factors and offsets apply only to Live Data Point view and will be disabled (greyed out) for live data feeds. |
||||||||||
| Q Zone Factor |
Available when viewing a zone. This is the factor you set up on the Live Data Zone page of the Live Data Zone property sheet. You can adjust this factor as well, and the results will feed back into the database. |
||||||||||
| Use adjustments |
|
||||||||||
| Show Flag Bars |
Enabled when viewing live data from Time Series Data format files. These files allow the use of flags to indicate the reliability or quality of each live data measurement. Check to display flag information on the graph. See the Live Data Flags topic for more information on displaying flag information. |
||||||||||
| Clear Selection | ~ | ||||||||||
| Start / Finish | The timescale shown on the graph can be adjusted by using these date time controls. | ||||||||||
| Zoom Range | Use to display the full extent of logger data on the graphs, including time offsets. | ||||||||||
| Zoom Control | If you have a control data set open, you can use this button to zoom to the time range in the control data. | ||||||||||
| Zooming | Zoom in on a part of the graph by holding down the Shift key, clicking within either graph, and then dragging the mouse with the left button held down. You will see a dotted box displaying the zoom area. | ||||||||||
| Graph area |
When graphing selected live data points or selected zone, the dialog displays two graphs - all flow data is shown in the upper graph, all pressure information in the lower graph. When graphing concentrations, the dialog displays one graph of concentration data. Graph properties can be changed by right-clicking the graph and choosing Graph properties. This will display the Graph Properties dialog. Note: Redrawing may be slow for live data feeds especially if the period covered is long.
|