
Use the Section dialog to specify the details of the CNC Section group.
To display the dialog, double-click the group's name in the Sequence Tree.
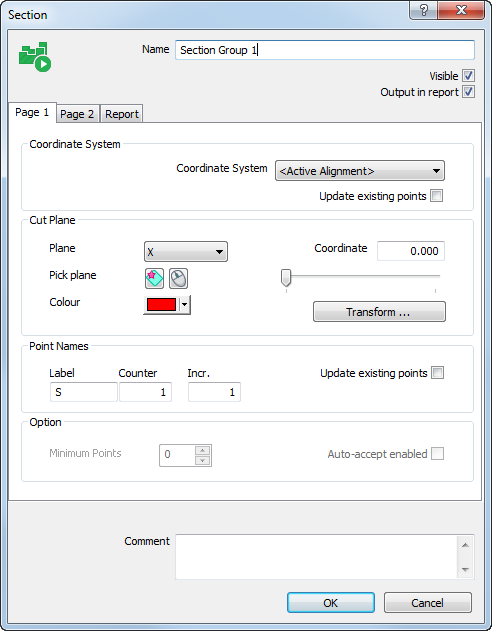
The dialog contains the following settings:
Name — Enter a name for the item. The name is used in the inspection sequence, in the Report and Info tabs, and when referencing the item in other items.
Visible — Select this check box to display the group's inspection points in the CAD view when Section Measurement Display mode is enabled.
Output in report — Select this check box to include the item in the report.
Coordinate system — Select the alignment or datum relative to which you want to measure the group points.
Cut Plane — Specify the plane along which you want to measure the section. To specify the colour of the section in the CAD View and Section View tabs, click the Colour swatch, and then click a box in the palette
- To use a major plane, select X, Y, or Z in the Plane list, and then enter a Coordinate value or move the slider to specify the point through which the plane must pass.
- To use a custom plane, click
 . In the CAD view, click and drag the cursor across the model. The coordinates of the point through which the plane must pass and the vector of the plane are displayed.
Alternatively, select <Custom> in the Plane list, and then click the
 buttons to enter the coordinates and vector manually. To inverse the coordinates or vector, click
 in the edit dialogs.
- To select a plane, display the plane in the CAD view and click
 . In the CAD view, move the cursor over the model and click the plane.
If you select a plane that parallels a major plane, the major plane and coordinate of the point through which the plane must pass are displayed; if you select another plane, <Custom> is selected in the Plane list, and the coordinates of the point and the vector of the plane are displayed.
Point names — Enter a Label, Counter, and Incr to control the naming of points added to the group.
- Label specifies the prefix or suffix of point names in the group. Enter a percentage sign (%) before the text to display it as a suffix.
- Counter specifies the first number of the point name.
- Incr. specifies the increment for the point name. For example, if Counter is 3 and Incr. is 2, the point numbers are numbered 3, 5, 7…
Select the Update existing points check box to rename existing points using the Label, Counter and Incr. values. For example:
- If a group contains points named SP-1, SP-3, SP-4 and SP-6, and you set the Label to SP-%-Part1, the Counter to 1 and the Increment to 1, the sequence becomes SP-1-Part1, SP-2-Part1, SP-3-Part1 and SP-4-Part1.
- If a group contains SP-1, SP-3, SP-4 and SP-6 and you set the Label to %-SP, the Counter to 100 and the Increment to 20, the sequence becomes 100-SP, 120-SP, 140-SP and 160-SP.
Comment — Enter any notes and extra information about the group.
Tab display — Specify how the section and the measurements are displayed in the Page 2 tab. Select:
- Draw tolerance lines to display the high and low tolerance values as dotted lines around the section.
- Scale to model factor to increase the size of the deviation pins and tolerance zones when you zoom in to the section. By default, the lines are displayed at 10 times measured deviation; enter a new value in the Factor box to change the magnification.
- Scale to view to leave the deviation pins and tolerance zones unchanged when you zoom in to the section. By default, the lines are displayed at 8 times measured deviation; enter a new value in the Factor box to change the magnification.
Default tolerances — Enter the tolerances to be used for points added to the group.
- Low specifies the low tolerance limit for the group.
- High specifies the high tolerance limit for the group.
To apply any tolerance changes to existing points, select Update existing points.
To revert to the tolerances specified in the Measure Parameters dialog, click Reset.
Default offset — Enter the details to apply an offset to all points in the group.
- Offset Surface – enter the offset for surface point nominals. This value can be the thickness of the pressing (usually a positive value), or as the spark gap for an electrode (usually a negative value). The offset is normal to the surface at the probed point. A positive value is towards the probe (outside).
- Offset Edge – enter the offset for the edge point nominals. The offset is normal to the surface edge at the probed point. A positive value is towards the probe (outside).
- Update existing points – applies the specified offset values to existing points.
- Reset – resets the offset values to the defaults specified in the Measure Parameters dialog.
Custom levels — When you measure an inspection group, PowerInspect matches the probed points to the nearest available surface. To restrict the surfaces that points can be applied to, use this section to specify the levels to which points can be assigned.
To specify the surfaces that can be used for this group:
- Select the Use custom levels check box, and then click the Levels button. The CAD Object Selection dialog is displayed.
- Click
 to expand the folders and display the CAD level and object entries.
- Select the check boxes of the entries you want to make available for inspection; deselect the check boxes to exclude them from inspection.
- Click OK to save your changes and close the dialog.
- Select the Update existing points check box to apply the level selection to points already in the group.
Report — Select this tab to specify the layout settings of the section group in the report. Select:
- Points list to display the list of points in the group.
- Repeat CAD View on each page if the group contains a
CAD View Report item and you want to display the CAD view on each page of the group's results. If the group contains:
-
- no CAD View Report items, selecting the check box has no effect.
- one CAD View Report item, the CAD view appears on each page of the report in which the group's data is displayed. Each CAD view displays only the points listed on that page.
- multiple CAD View Report items, each CAD view displays the points that precede it in the group.
- Tolerance plot to display the tolerance for each point compared to the in-tolerance range.
- Statistics table to display the statistics for the group.
- Distribution chart to display the tolerance distribution for the group.
- Save as default to use these layout settings as the defaults for new groups in the report.
-
Click OK to close the dialog and save your changes.