
Change process reporting
Note:
For users with Fusion connected sites, references to the 'Items' workspace should be the 'Components' workspace.
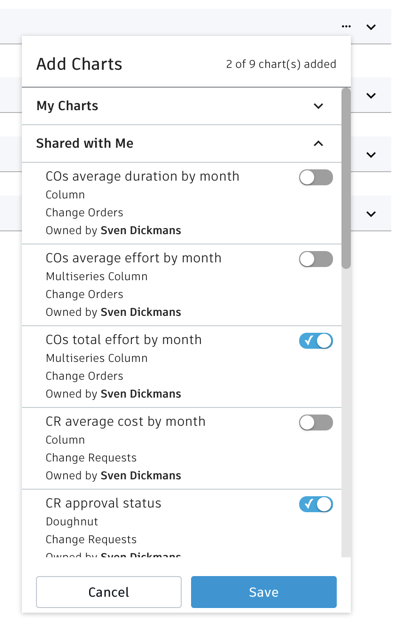
This template provides public reports. Anyone with access to the relevant workspaces can add these charts to their landing page from the Shared with Me section:
| Report Name | Description |
|---|---|
| COs average duration by month | Column chart showing the average processing time of all change orders, grouped by month |
| COs average effort by month | Column chart showing the average total actual effort of all change orders, grouped by month |
| COs total effort by month | Column chart showing the total actual effort of all change orders, grouped by month |
| CR approval status | Doughnut chart showing the ratio of approved vs. rejected change requests |
| CR average cost by month | Column chart showing the average total cost of all change requests, grouped by month |
| CR cost by reason code and month | Stacked column chart showing the total cost of all change requests, grouped by month and split by Change Reason Code |
| CR total cost by month | Column chart showing the total cost of all change requests, grouped by month |