The toolbars are usually found anchored at the top of the window. However, they are a simple form of Dockable Window and so you can anchor them on another edge of the window, or leave them floating to give a larger working area. They cannot be resized. See Using Dockable Windows.
The toolbars can be shown or hidden, or the buttons on the toolbars re-organised. See Customising the Toolbars.
Overview toolbar

|
|
Dynamic Innovyze Live Server connection state. The colour of the button provides a visual cue of the server connection state and, when clicked, the Configure server connection dialog is displayed. This dialog allows users to configure connections to the Innovyze Live Server. The initial colour of the button is grey (
|
||||||||||||

|
Enabled in the Network page. Displays the Overview Page. |
||||||||||||
|
|
Refreshes run lists and update the information displayed in the Summary Window. This refresh applies to all manifests contained in the currently selected manifest deployment. Tip: It is possible to refresh run lists for the currently selected manifest only via the
Select an Item dialog.
|
||||||||||||
|
|
Enabled in the Overview page. Click
|
||||||||||||
|
|
Enabled in the Overview page. Opens an HTML file, which contains the results of a System Health Check, in your web browser. |
||||||||||||
|
|
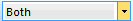
Enabled in the Overview page. Use the Alert Display dropdown to choose which alerts results you would like displayed on the GeoPlan Window of the Overview Page. The options are:
The setting of the dropdown is saved with the workspace. |

 ) and this version of the button may only appear briefly when the client is starting up and before the connection state is initialised. The other possible statuses are detailed below:


Manifest toolbar

|
|
Manifest mode of operation: Normal - Manifest schedule to run as specified. Manual runs only - Runs can only be generated manually by the user. Ignore alert triggers - Alert triggers will be ignored. Users may wish to select this option if there is a spurious alert that keeps triggering full model runs unnecessarily. Edit the mode of operation as required. Tip: Changing the mode of operation can be
permissioned in
InfoWorks ICM Ultimate or
ICMLive Configuration Manager and therefore may not be available to
ICMLive Operator Client users who have not been granted rights to perform this action.
|
|
|
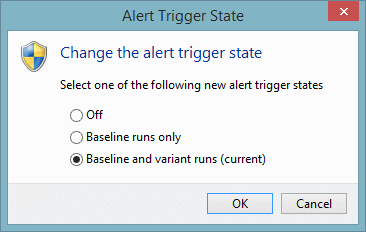
Only enabled when the Innovyze Live Server is connected. Modify alert trigger toggle. The current alert trigger state for each manifest deployment is displayed in the Server Simulation Schedule Window dialog. Click
Choices are:
Select an alert trigger state and click Ok. Tip: Edits to the alert trigger state can be
permissioned in
InfoWorks ICM Ultimate or
ICMLive Configuration Manager and therefore may not be available to
ICMLive Operator Client users who have not been granted rights to perform this operation.
|
|
Mode of operation for updating the Network Page after run completion:
|


Selection toolbar
This toolbar groups together commands that are used on a selection of network objects.

|
|
Enabled in the Network page. Click
This tool is only available when a run is displayed in the GeoPlan Window. |
|
|
Enabled in the Network page. Click
This tool is only available when a run is displayed in the GeoPlan Window. |

|
Select all objects in the network. |

|
De-select all currently selected network objects. |

|
Invert the current selection. Use this button to de-select all objects that are currently selected, and select all those that are currently not selected. |

|
Enabled in the Network page. Select all objects contained in the currently selected Polygon (or Area of Interest) object. |
|
|
Lets you to select a group of network objects within a defined area. Click
Press CTRL and double-click at the last point to add all objects within the polygon to the current selection. |


GeoPlan toolbar
This toolbar contains tools for navigating round the GeoPlan Window.

|
|
Click
To select several objects, press CTRL and then click individual objects. These are added to the current selection. Clicking on a selected object while pressing CTRL removes the object from the selection. |

|
Enabled in the Network page. Click
|
|
|
Click
The distance is displayed in the
status bar
|
|
|
Click
|
|
|
Click
|
|
|
Click
|
|
|
Enabled in the Network page. Click
Tip: Object properties can only be displayed for network objects contained in
selectable object layers. If the desired object is not selectable using the
 tool, this indicates that the layer associated with this object may have been marked as unselectable. See the
Layers and Themes page of the GeoPlan Properties dialog for details on how to make layers selectable. tool, this indicates that the layer associated with this object may have been marked as unselectable. See the
Layers and Themes page of the GeoPlan Properties dialog for details on how to make layers selectable.
|
|
|
Displays the GeoPlan Find Dialog. You can use this dialog to search for an object in a GIS layer. |
|
|
Find, and possibly zoom in on, a specific XY coordinate. Displays the Go To XY Coordinates dialog. See Find and Zoom Using XY Coordinates for more information. |
|
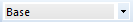
Dropdown of the baseline and variant networks available for the current manifest. Select a network from the list to change the network displayed in the GeoPlan Window. Note: Only the network is changed and not the display of results.
|


 . The first figure is the distance from the start point to the last clicked point. The second figure is the distance from the last clicked point to the current position of the cursor. The third figure is the total distance from the start to the current cursor position.


Replay control toolbar
This toolbar provides all the operations required to view a replay of a simulation.
This toolbar is enabled in the Network page.

|
|
Jump to the start of the simulation. |
|
|
Step back in time through the simulation. |
|
|
Pause the replay. |
|
|
Step forward in time through the simulation. |
|
|
Play a replay of the results throughout a simulation. |
|
|
Start the process of recording a simulation replay as an AVI video file. See Recording a Replay as an AVI File for more information. |

|
Play a continuously looping replay of the results of the simulation . |
|
|
Jump to the end of the simulation. |
|
|
Displays the Replay Options dialog, used to select results for a particular time during the simulation. |
|
|
Display maximum results values. |


Results toolbar
This toolbar is enabled in the Network page.

|
|
Click
In this mode, click a network object and choose one or two parameters to graph for that object. You can also press the CTRL key when clicking an object. This displays a grid of all the object parameters. See Viewing Simulation Results topic for further details. |
|
|
Click
In this mode, click a network object to display a grid of time-varying results for that object. This tool is an alternative to using the above Generate Graph tool and pressing the CTRL key. See Viewing Simulation Results topic for further details. |

|
Generates an event report. This is only available when looking at a full run. When an event report is generated using this tool, results are exported from simulations with run origin within a time range relative to the run origin of the currently displayed run. The export time range and other event report parameters are configured in the Manifest in InfoWorks ICM Ultimate or ICMLive Configuration Manager. |

|
Opens a Custom Graph Window displaying the custom graph selected in the dropdown to the right of the button. This is only available when looking at a run. |
|
Dropdown list of the Custom Graphs available for the current manifest. This is only available when looking at a run. Custom graphs are configured in InfoWorks ICM Ultimate or ICMLive Configuration Manager. |

