The Simulation View tab provides various options for controlling and interacting with the simulation display.

CNC Overlay
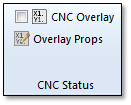
The CNC Overlay provides an overview of the current simulation modal state as an overlay on the 3D view. It is accessed through the CNC Status panel on the Simulation View tab:
To control the overlay, follow these steps:
Click CNC Overlay to see the overlay in the 3D View:
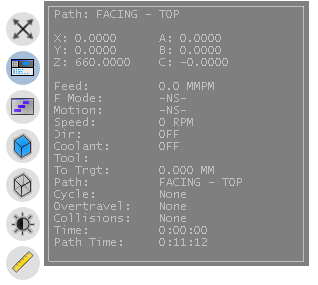
The overlay shows the following info:
XYZ ABC – The current machine coordinates.
Feed – Current feed rate.
F Mode – Current feed rate mode (per minute, per rev, etc.).
Motion – Current movement mode (rapid or cutting).
Speed – The spindle speed.
Direction – The spindle direction.
Coolant – Current coolant mode.
Tool – The current cutting tool.
To Trgt – The distance to the current target position during a move.
Path – The current tool path name
Cycle – The current canned cycle (if applicable).
Overtravel – Current list of over travelled axes.
Collisions – Current of colliding axes and objects.
Time – The current over-all simulation time.
Path Time – The time of the current path.
Click Overlay Props to modify the 3D Overlay:
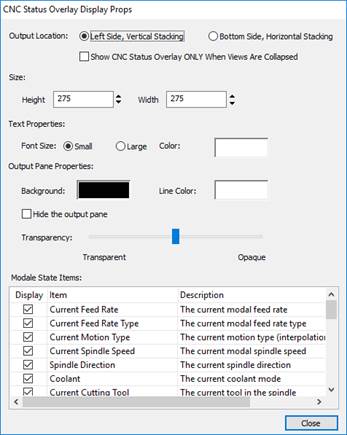
Output Location – Controls where on the 3D view the overlay is displayed.
Size – Set the Height and Width of the overlay (in pixels)
Text Properties – Control the font size and color of the text in the overlay.
Output Pane Properties – Set the background and line colors and control the transparency of the overlay from completely transparent to opaque.
Modal State Items – This controls which items are shown in the 3D CNC overlay. The Display column controls if the item is shown or not.
Simulation Slider
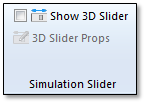
The 3D Simulation Overlay slider allows you to control the simulation slider as an overlay in the 3D view. It is accessed through the Simulation Slider panel:
To control the overlay, follow these steps:
Click Show 3D Slider to display the slider:

2.* This slider works just like the standard simulation slider.
Click 3D Slider Props (while the slider is displayed) to access its properties:
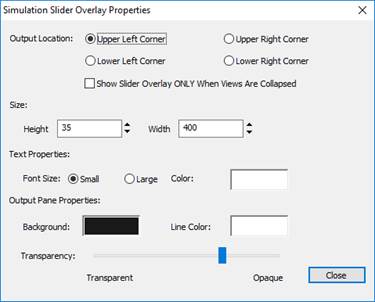
Output Location – Controls the location of the slider in the 3D Display.
Show Slider Overlay ONLY When Views Are Collapsed – This option will only show the overlay slider when the other views are collapsed.
Size – Control the height and width of the overlay in the pixels.
Text Properties – Control the text size and color.
Output Pane Properties – Set the background and line colors and control the transparency of the overlay from completely transparent to opaque.
View Target Control
The simulation view target and alignment is controlled through the View Target and View Alignment panel:
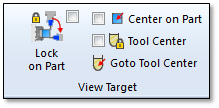
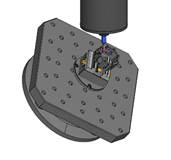
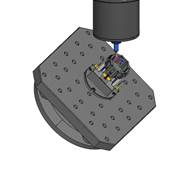
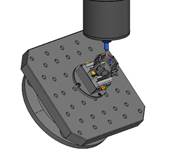
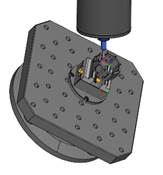
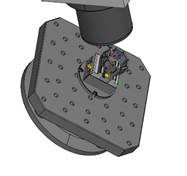
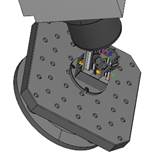
Lock On Part – Will keep the view orientation locked to the part during simulation. This works very similar to too move mode but all machine motions are properly simulated. Normally, you would want to hide everything on the machine but the work table and spindle when using this mode.
Normal Simulation:
|
|
|
|
|
Position 1 |
Position 2 |
Position 3 |
Lock On Part Simulation:
|
|
|
|
|
Position 1 |
Position 2 |
Position 3 |
Tool Center – This version will center the view on the tool center and follow it during simulation.
Goto Tool Center – Re-centers the view on the current tool center. Once clicked, the view will not stay centered on the tool during simulation.
View Scaling
You can quickly scale the view as needed with the Scaling panel:
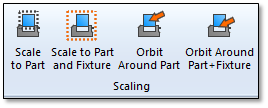
Scale to Part – Scale the view to show the entire part. If the geometry is hidden, it will not be shown but still used for scaling.
Scale to Part and Fixture – Scale the view to show the entire part and fixture. If the geometry is hidden, it will not be shown but still used for scaling.
Orbit Around Part – Set the orbit point for the view to be centered around the part geometry. If the geometry is hidden, it will not be shown but still used for the center.
Center Around Part+Fixture – Set the orbit point for the view to be centered around the part and fixture geometry. If the geometry is hidden, it will not be shown but still used for the center.
View Alignment
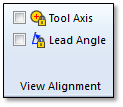
Tool Axis – Will align the view with the tool axis and follow it during simulation. This lets you look down through the tool from the spindle perspective.
Lead Angle – Aligns the view with the lead angle (side view) and follows it from the simulation.
Showing the Start and End Points Of Each Motion
It is often helpful to view the start and end points of each motion in the 3D display. This can be helpful in visualizing the entry and exit moves for each operation.
Make sure that your tool motions you want to see are appearing in the 3D view (they should not be hidden).
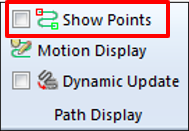
Click Show Point on the Path Display panel on the Simulation View tab:
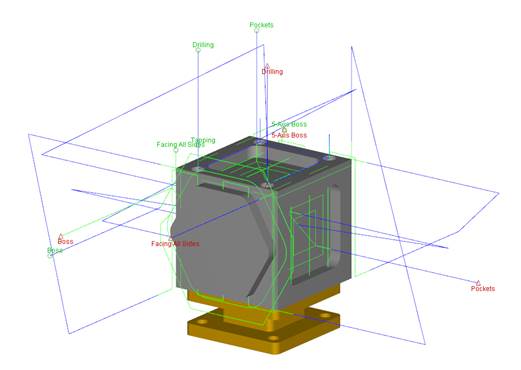
The start and end points of all visible paths will be displayed along with the name of the operation:
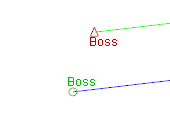
The start points appear with the green circle and the end points with the red triangle:
Click Show Path Start and End Points again to hide the end points in the 3D display.
Tool Motion Simulation Display
Autodesk CAMplete TruePath can help identify areas where there are low or high feed rate values by drawing them in different colors.
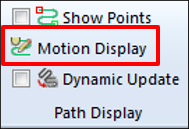
Click Motion Display on the Path Display panel on the Simulation View tab:
The Tool Motions Simulation Display dialog will appear:
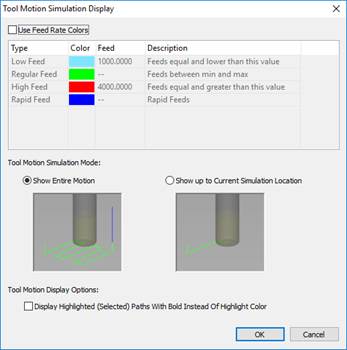
Click Use Feed Rate Colors to enable the feed rate color visualization.
In the grid choose a color and a value for the minimum feed rate. This means that any feed at this value or LESS, will be displayed with this color.
Choose a color and a value for the maximum feed rate. This means that any feed at this value or GREATER, will be displayed with this color.
Choose a color for the Regular feed (which is greater than the minimum feed and less than the maximum feed).
Choose a color for the Rapid feeds.
Click OK to close the dialog.
The motions will now be drawn with different colors based on the values you entered above:
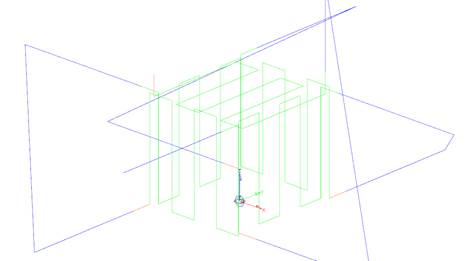
You can turn off the Feed Rate coloring by going back to the Tool Motion Simulation Display dialog and un-checking the Use Feed Rate Colors button.
Note: Changes that you make to the Regular Feed and Rapid motion will always remain active.- Note: When you enable this option, it will stay active even if the software is restarted.
- Note: The values for the minimum and maximum feed have no units.
Tool Motion Drawing Mode
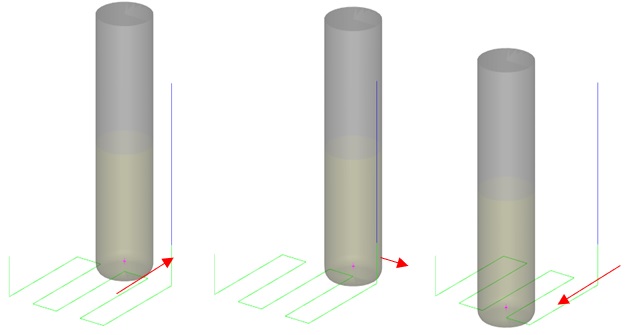
Autodesk CAMplete TruePath can be set to draw the current tool motion ONLY up to the selected simulation point. Under normal operation, when simulating through a tool path, the motion is always shown in its entirety:
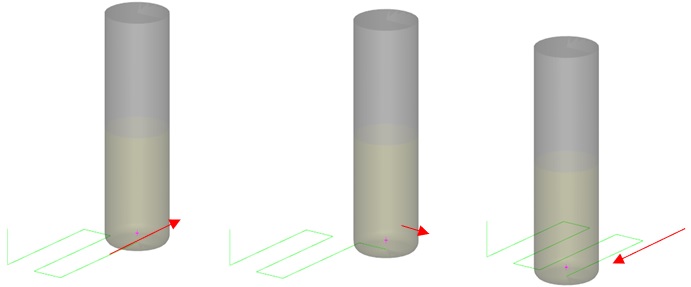
TruePath can now be set to only show up to the current simulation point:
Click Motion Display on the Path Display panel on the Simulation View tab:

The Tool Motions Simulation Display dialog will appear:
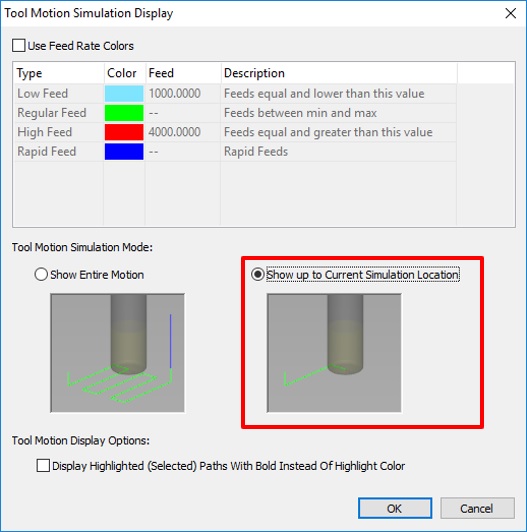
Click OK.
Now, the simulation will only show up to the currently selected simulation location.
Highlighting the Current Motion in Bold
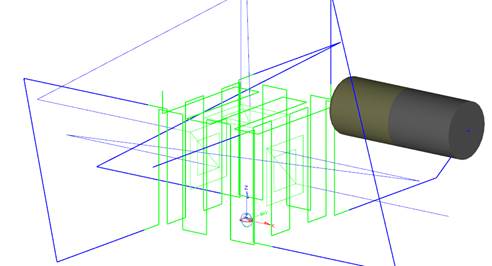
By default, when a current tool motion (or tool path) is selected, it will be drawn as yellow in the 3D display. This will happen during simulation as well. This can negate the advantages of the feed rate display colors since the entire motion will be drawn in the yellow highlight color. To solve this, you can switch the tool motion highlighting to draw selected tool motions with a heavier (bold) line in the 3D view.
Click Motion Display on the Path Display panel on the Simulation View tab:

The Tool Motions Simulation Display dialog will appear
Enable Display Highlighted (Selected) Paths With Bold Instead Of Highlight Color:
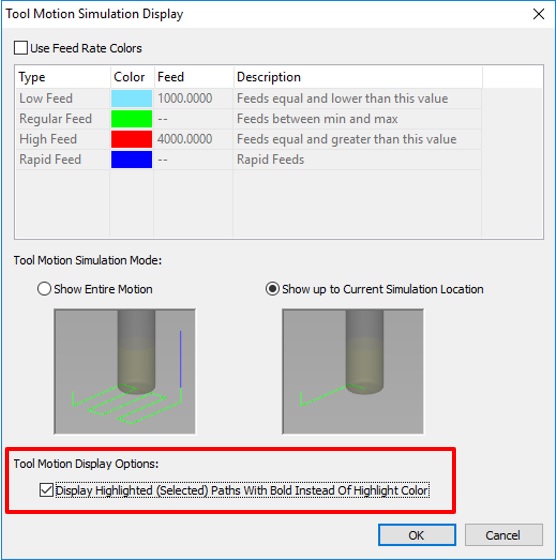
Click OK to commit this change.
Highlighted motions will now be drawn in bold:
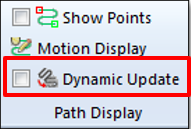
Showing only the current tool path
To show only the current tool motion, enable the Dynamic Update option:
Work Table Level
You can control which components of the work table are shown.
Decrease – Show less components.
Increase – Show more components.
By increasing the “level” more components will be shown, starting with the work table first:
|
|
|
|
|
Increased level |
Decreased Level |
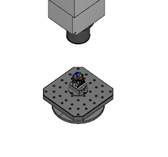
Spindle Level
You can control which components of the spindle are shown.
Decrease – Show less components.
Increase – Show more components.
By increasing the “level” more components will be shown, starting with the spindle first:
|
|
|
|
|
Increased level |
Decreased Level |
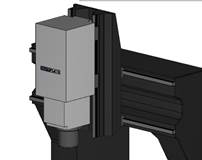
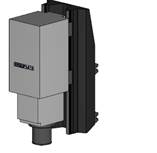
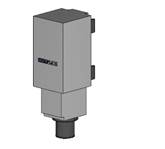
Visibility Panels
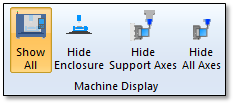
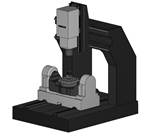
Show All – Shows the machine enclosure, body parts and all axis components.
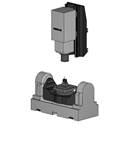
Hide Enclosure – Hides the machine enclosure and body parts but shows all of the a
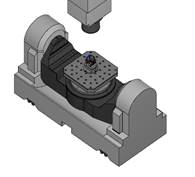
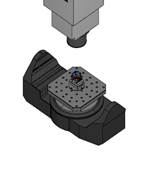
Hide Support Axes – Shows just the work table and spindle. All other axes are hidden.
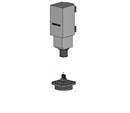
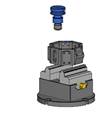
Hide All Axes – Shows only the part and cutting tool. However, all parts of the machine are still simulated and checked for collisions.
|
|
|
|
|
|
Show All |
Hide Enclosure |
Hide Support Axes |
Hide All Axes |
Visibility

Visibility – Shows the Visibility Wizard. (See previous section)
Errors

Summary – Shows the Error Summary view. (See The Error Summary View - Page 6)
Jog Axes

Click Jog Axes to toggle the Jog Milling Machine view:
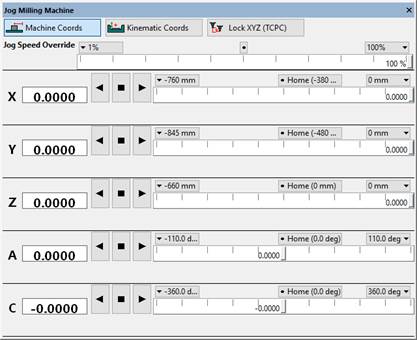
The Jog view can be used to manually move the machine axes. This can be useful for checking clearances, travel ranges and other potential issues that can occur on the machine.

Machine Coords – Shows the axis coordinates as machine coordinate values (relative to each axis zero position).

Kinematic Coords – Shows the axis coordinates as kinematic coordinate values (relative to kinematic center point of the machine, where the rotary axes intersect).

Lock XYZ (TCPC) – Emulates Tool Center Point Control. When enabled, jogging the rotary axes will keep the tool center point at the same location relative to the work piece.

Jog Speed Override – Set the speed for the Auto-jog of the axes. (See below)
Each axis is listed and can be controlled individually.

Axis Position – The current position of the axis. This can be edited directly or adjusted with the slider bar.

Auto-Jog Negative – Auto jog the axis in the negative direction until the limit is reached. The jog speed is controlled by the Jog Speed Override slider at the top of the view.

Auto-Jog Stop – Stop the Auto-jog of the axis.

Auto-Jog Positive – Auto jog the axis in the positive direction until the limit is reached. The jog speed is controlled by the Jog Speed Override slider at the top of the view.
The slider bar has buttons for selecting the axis Minimum, Home and Maximum positions.
You can also manipulate the axes directly in the 3D view:
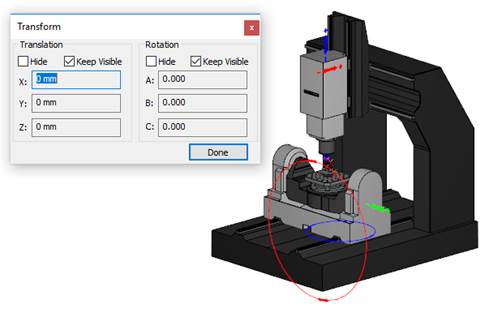
To move an axis, click its arrow in the view and move the mouse. The axis will be moved as you move the mouse. You can also directly click the machine geometry in the view and it will be selected for jogging.
Windows
Program Editor – Hide and show the Program Editor view.
Simulation Controls – Hide and show the Simulation controls view.

