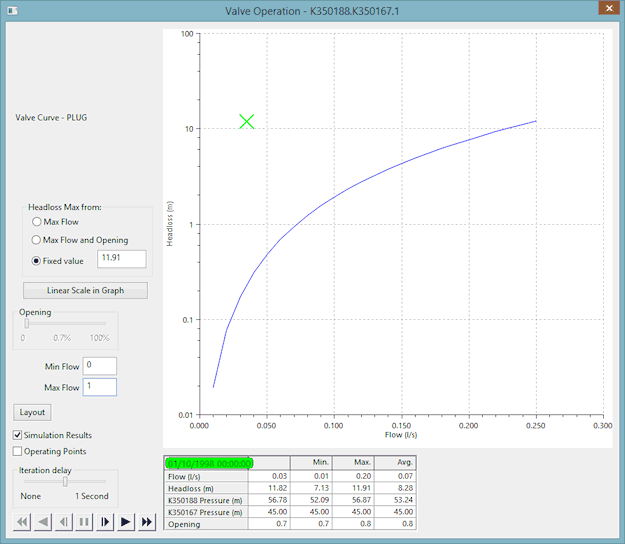
| Headloss Max from:
|
| Option
|
Definition for non-simulation results
|
Definition for simulation results
|
|---|
| Max Flow
|
Maximum Headloss axis value is set to show headloss at maximum flow at the current valve percentage opening. The Headloss axis range does not change as valve percentage opening is changed.
|
Flow axis range is set by min and max flow values. Headloss axis range is set to show headloss at maximum flow at current valve percentage opening. The Headloss axis range does not change as valve percentage opening varies.
|
| Max Flow and Opening
|
Maximum Headloss axis value is set to show headloss at maximum flow. The range is adjusted with change in valve percentage opening.
|
Flow axis minimum value is set by min flow value. Both Flow and Headloss axes maximum values are adjusted with change in valve percentage opening.
|
| Fixed value
|
Maximum Headloss axis value is set at the value specified in the accompanying box.
|
Flow axis range is set by min and max flow values. Headloss axis range is set at fixed value.
|
|
| Linear Scale in Graph /Log Scale in Graph
|
Changes between log and linear scale on the graph.
|
| Opening (slider)
|
Available only when the Simulation Results box is unchecked.
Allows you to change the percentage opening of the valve.
|
| Min Flow
|
For entering the minimum flow value.
|
| Max Flow
|
For entering the maximum flow value.
|
| Layout (button)
|
Changes the layout of the dialog and graph. Several layouts are available by clicking the button repeatedly.
|
| Simulation replay options and controls
|
Additional options are added to the dialog if you open the report for a valve in a completed simulation:
| Simulation Results
|
If checked, displays the current operating point for the valve.
|
| Operating Points
|
If checked, displays all the operating points for the valve during the simulation.
|
| Iteration delay
|
Because the dialog only replays data for the valve, instead of the whole network, replay at full speed is too quick for realistic analysis. You can use this slide control to set a sensible delay that allows you to see the behaviour clearly.
|
| Replay Control Buttons
|
You can control the replay of the valve results in exactly the same way as for the main simulation replay.
|
| Parameters Grid
|
Shows important values at the current timestep, along with minimum, maximum and average values.
|
|
| Context menu
|
| Print graph
|
Opens a Print dialog, for printing the graph.
|
| Copy graph
|
Copies the graph into the clipboard.
|
| Graph properties
|
Opens the Graph Properties dialog.
|
| Export traces to CSV
|
Opens a Windows Save As dialog, for choosing a location and name of a CSV file to contain the graph trace data.
|
| Print view
|
Opens a Print dialog, for printing the view contained within the dialog.
|
|

