Time Navigation
Time Navigation lets you explore historical facility data through heatmaps, charts, pins, and the properties panel—helping you analyze past performance and make informed decisions.
Navigation

| Key | Description |
|---|---|
| 1 | Open & Close the Timeline: View and scrub through alerts and threshold events across your facility. |
| 2 | Current Time status tells users if the data being viewed is live (pink dot), or past data (completely greyed out). |
| 3 | Time Picker: Select a specific date/time to inspect detailed building data from that moment. |
| 4 | Zoom in or out on the timeline. |
| 5 | Play Button: Replay historical data and watch visualizations update over time. |
| 6 | Loop the playing of the timeline that is present on the screen. |
| 7 | Play Speed adjusts the play speed of the timeline. |
| 8 | Click and drag the Play Scrubber to view past IoT data. |
Some Highlighted Features
Open a facility and locate the Time Navigation bar.

Utilize the timeline by hovering the mouse of the section that indicated being out of range, or click one of the sections to jump to past alerts or events.

Pick a Date with the Time Picker to inspect the historical context.

Press Play to auto-advance through time and stream past data.
There are several benefits to Time Navigation:
- Identify trends and anomalies
- Review building conditions during specific events.
- Optimize operations with historical insights.
Pro-Tip!: Enable Thresholds for even better, more detailed visual insights into your facility.
There are two ways to view these insights
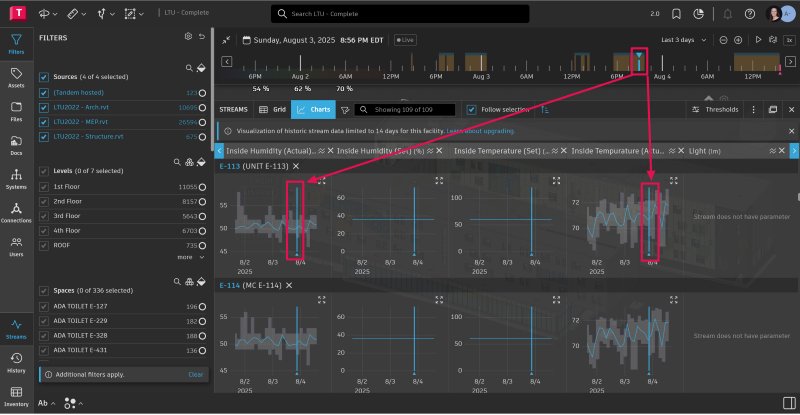
Time Navigation + Charts The play scrubber in the Time Navigation bar, syncs with the play scrubber in the charts

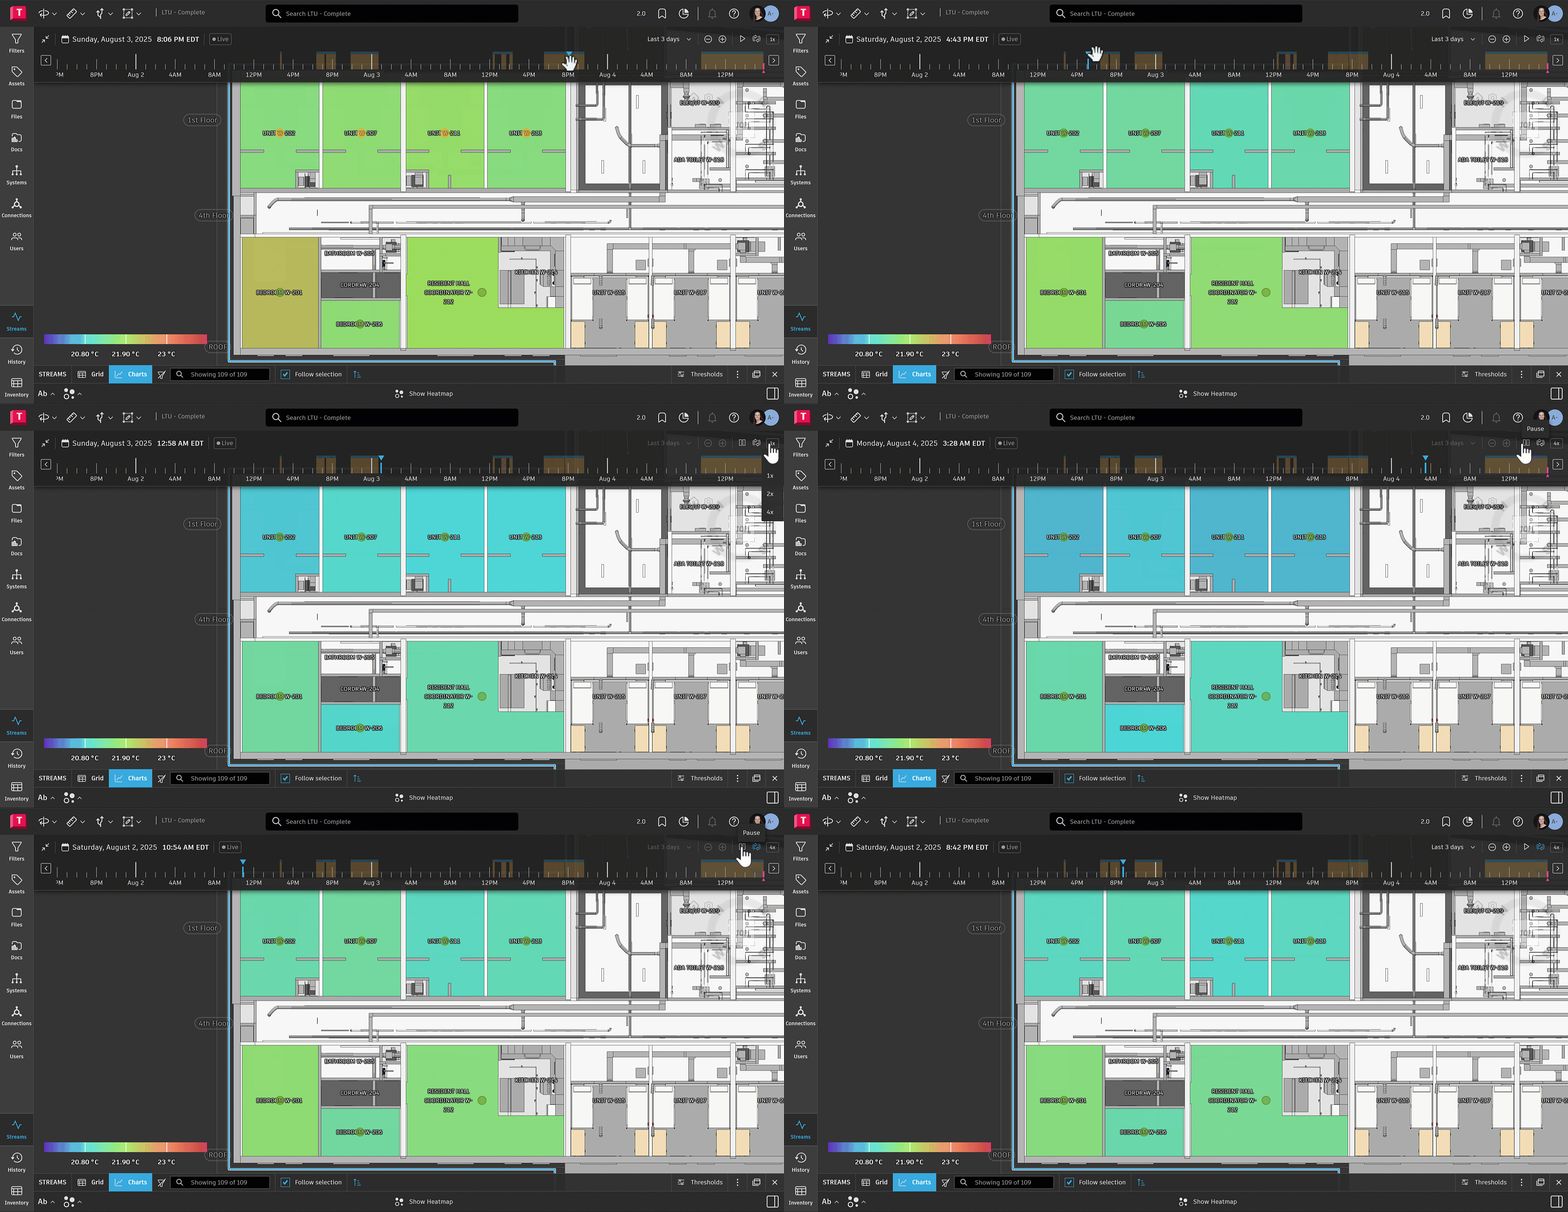
Time Navigation + Heatmap By manually moving the play scrubber or by hitting play, users can view a heatmap of data received by IoT devices over time.
NOTE: The Streams panel must be open for the heatmap to function. In the gif below, we have the Steams panel minimized.

