
Material Property Table, Form 1
Description: Defines a tabular function for stress-dependent material properties such as the stress-strain curve.
Format:
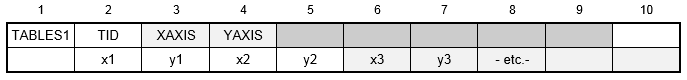
Example:

| Field | Definition | Type | Default |
|---|---|---|---|
| TID | Table identification number. | Integer > 0 | Required |
| XAXIS | Specifies a linear or logarithmic interpolation for the x-axis, one of the following character variables: LINEAR or LOG. | Character | LINEAR |
| YAXIS | Specifies a linear or logarithmic interpolation for the y-axis, one of the following character variables: LINEAR or LOG. | Character | LINEAR |
| xi, yi | Tabular values. | Real | 0.0 |
Remarks:
- xi must be in either ascending or descending order, but not both.
- Discontinuities may be specified between any two points. If y is evaluated at a discontinuity, then the average value of y is used. In Figure 1, the value of y at x = x3 is y = (y3 + y4)/2.
- At least one continuation entry must be specified.
- Placing SKIP in either of the two fields may ignore any xi-yi pair.
- The end of the table is indicated by the existence of ENDT in either of the two fields following the last entry. Any continuations that follow the entry containing the end-of-table flag ENDT will be ignored.
- TABLES1 uses the algorithm
 where x is input to the table and y is returned. The table look-up is performed using linear interpolation within the table and linear extrapolation outside the table using the two starting or endpoints, see Figure 1. No warning messages are given if table data is input incorrectly. The algorithms used for interpolation or extrapolation are:
XAXIS YAXIS y(x) LINEAR LINEAR 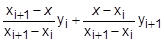
LOG LINEAR 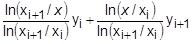
LINEAR LOG 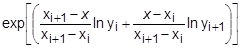
LOG LOG 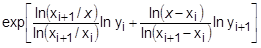
where xi < x < xi+1
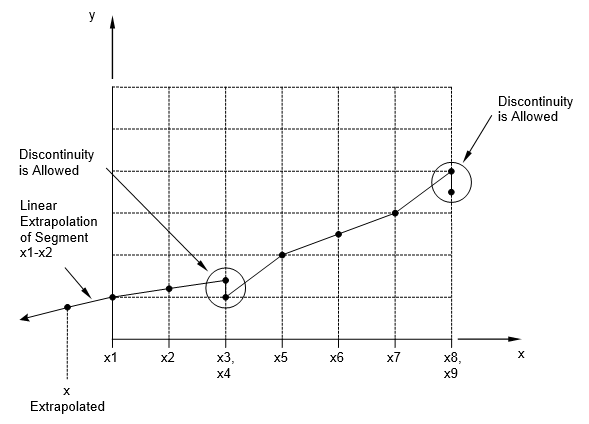
Figure 1. Example of Table Extrapolation and Discontinuity
- Tabular values on an axis if XAXIS or YAXIS equals LOG must be positive.