
Multiaxial Fatigue Data
Description: Defines data needed for multiaxial fatigue analysis.
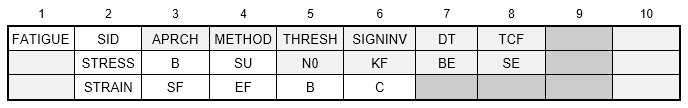
Format:
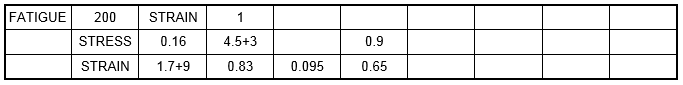
Example:
| Field | Definition | Type | Default | |||
|---|---|---|---|---|---|---|
| SID | Set identification number. | Integer > 0 | Required | |||
| APRCH | Fatigue life approach, one of the following character variables: STRESS, STRAIN, or blank. | Character | See Remark 2 | |||
| METHOD | Life calculation method, selected by one of the following values
|
Integer | 2 | |||
| THRESH | Percentage of amplitude threshold. See Remark 5. | Real ≥ 0.0 | 0.0 | |||
| SIGNINV | Signed stress/strain invariant option: YES, NO, or AUTO. See Remark 7. | Character | NO | |||
| DT | Event duration used to determine life. See Remark 6. | Real > 0.0 | See Remark 6 | |||
| TCF | Factor to convert DT and life output to units other than seconds. See Remark 6. | Real > 0.0 | 1.0 | |||
| B | S-N curve slope. See Remark 3. | Real > 0.0 | See Remark 2 | |||
| SU | Intercept stress level. Typically taken as the material ultimate stress. See Remark 3. | Real > 0.0 | See Remark 2 | |||
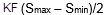
| N0 | Intercept cycles. See Remark 3. | Integer > 0 | 1000 | |||
| KF | Factor applied to compensate for life reduction effects such as finish, corrosion, and notch effects. See Remark 3. | Real > 0.0 | 1.0 | |||
| BE | Slope after endurance limit. See Remark 3. | Real > 0.0 | 0.1*B | |||
| SE | Endurance limit. See Remark 3. | Real ≥ 0.0 | 0.2*SU | |||
| SF | Coefficient of fatigue strength. See Remark 4. | Real > 0.0 | See Remark 2 | |||
| EF | Coefficient of fatigue ductility. See Remark 4. | Real > 0.0 | See Remark 2 | |||
| B | Exponent of fatigue strength. See Remark 4. | Real > 0.0 | See Remark 2 | |||
| C | Exponent of fatigue ductility. See Remark 4. | Real > 0.0 | See Remark 2 |
Remarks:
- FATIGUE entries must all have unique set identification numbers.
- The APRCH field is required when neither the SNDATA nor ENDATA Bulk Data entries are included. The data provided on the continuation entries serve as default values for properties normally defined on these entries. Values not specified on SNDATA entries will be replaced with ones from the STRESS continuation and values not specified on the ENDATA will be replaced with ones from the STRAIN continuation.
- The S-N curve shown in Figure 1 is characterized by the following equations:
If

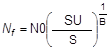
If

where,
 is the number of cycles to failure
 is the amplitude of input stress
 is the number of failure cycles at the endurance limit
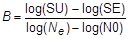
and the slope B is shown in Figure 1 is calculated by:
- The
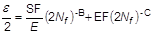
 curve shown in Figure 2 is characterized by the equation:
where,
 is the range of strain (
 -
-
 )
)
 is the number of cycles to failure
 is the modulus of elasticity
- Amplitude filter. When the amplitude change between two sequential data is less than the threshold percent of the maximum range, the data is discarded in life calculation.
- The default value for DT is determined using the difference between the largest and smallest
TABLEDi times (time range). If the specified DT is smaller that this time range, it is set equal to it. DT is useful when the event duration is different from the time range due to idling time. TCF is a time conversion factor that is typically used to convert a default DT time from seconds to another set of units such as hours. Life output will be in the same units as DT where life is defined using:

where,
Damage is the ratio of applied cycles over cycles to failure.
- The SIGNINV option specifies if the stress/strain used in the life calculation method should be signed. The invariant stress/strain options are by definition positive values, and the sign of the load is determined using the TABLEDi load cycle data. When SIGNINV is set to YES, the sign of the invariant is determined based on the principal stress/strain. When SIGNINV is set to NO or blank, the invariant stress/strain is always positive.
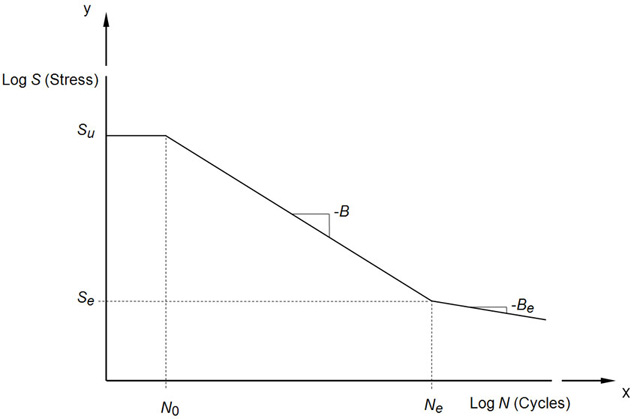
Figure 1. Stress-Life Curve Format
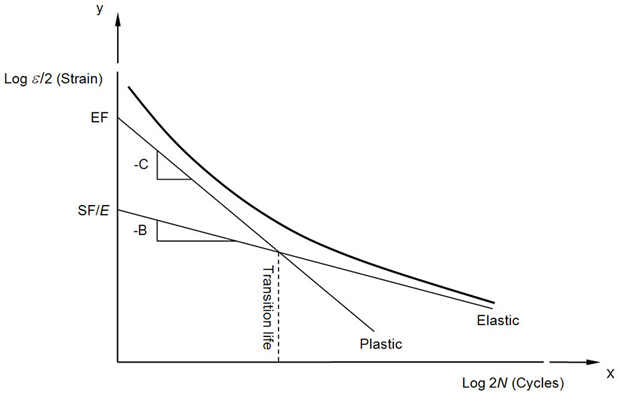
Figure 2. Strain-Life Curve Format